metalblade
Well-Known Member
- Joined
- Sep 6, 2005
- Messages
- 15,957
- Reaction score
- 23,934
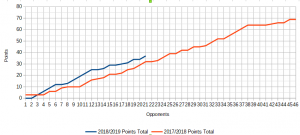
The points prediction seems to get less after each game just now and the comparison graph to last season shows very similar trends I'm afraid. Not good reading.
Follow along with the video below to see how to install our site as a web app on your home screen.
Note: This feature may not be available in some browsers.
All advertisments are hidden for logged in members, why not log in/register?
15 comparable games versus last season.
17/18 - W4 D4 L7 = 16 points
18/19 - W8 D2 L5 = 26 points
What nonsense is this?
We're three points down on last season.
Games against teams we played last season.
What about teams we didn't play?
What about teams we didn't play?
Let me explainWhat nonsense is this?
We're three points down on last season.
Let me explain
Rather than grafikhaus comparing our position at this point last year to this year , which is in itself really interesting, I am comparing how we did in the same head to head matches last year to this year
So, for example against leeds at home last year we won. This year we lost, so we are 3 points down.
Overall in the 15 comparable games versus last season we are currently 10 points up
17/18 - W4 D4 L7 = 16 points
18/19 - W8 D2 L5 = 26 points
If you compare the 5 other games we've played against teams relegated or promoted to this league we are about 5 points down on last year. So overall we are 5 points ahead on comparable games.
It's an alternative view to the grafikhaus approach but without the graphs.
Neither does posting where you were last season. It's just a bit of fun.Why such a contrived way of doing it though?
It's meaningless, It doesn't tell you anything.
If you compare the 5 other games we've played against teams relegated or promoted to this league we are about 5 points down on last year..
Thanks Silent, my logic for 5 behind is belowLast season we got 19 points from playing against Wolves, Cardiff, Fulham, Barnsley, Burton and Sunderland.
This season we got 8 points from Swansea, Stoke, Rotherham, Wigan and Blackburn.
19/36 (2017-18)
8/15 (2018-19)
Much less than 5 points down on last season
Understood. My logic is that if we beat West Brom on the 14th, we are doing slightly better on average than last season, slightly worse on average if we dont win.Thanks Silent, my logic for 5 behind is below
the 5 games look like this based on comparable positions, so a 5 point deficit
Swansea (home_lost) - Wolves - difference @ - 3
Stoke (home_drew)- Cardiff difference @ 0
West Brom - Fulham
Wigan (home_won)- Barnsley difference @ 0
Blackburn(away_won) - Burton - difference @ 0
Rotherham(away_drew) - Sunderland difference @ - 2
I've tried to extend the "comparable" games but you are right on average. I think the point I'm trying to make is that we "might" have had a more difficult run of games this year and therefore might find we are in a better position than our points tally so far shows.
On the other hand, it's all a bi of trivial shit ;-)
Why such a contrived way of doing it though?
It's meaningless, It doesn't tell you anything.
Why such a contrived way of doing it though?
It's meaningless, It doesn't tell you anything.
What nonsense is this?
We're three points down on last season.
What nonsense is this?
We're three points down on last season.
What nonsense is this?
We're three points down on last season.
Good, we've got our bad patch out of the way early this season!
grafikhaus . looking at your graph we got 9 points from the next 9 games. Hopefully we can improve quite a bit on that


Comparing results against opponents (or the team that replaced promoted / relegated sides) we a re still 5 points up on last season
2017/18 - W9 D5 L7 = 32
2018/19 - W11 D4 L6 = 37
4 points earned from the next 3 games last season
Graph would make more sense with opponents on x-axis than game numbers but I've not worked out how to do that yet ;-)
View attachment 46739View attachment 46739
Are you using Microsoft Excel?
Not at the moment, it's on some open source thing , but I could transfer it to excel if needed.Are you using Microsoft Excel?
Are you using Microsoft Excel?
All advertisments are hidden for logged in members, why not log in/register?
