View attachment 5357
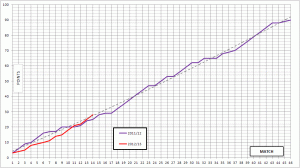
Right! I've made the trend line 'polynomial' (me neither) and it appears to work...
The steep diagonal trend line closely resembles our 90 minute struggle against so called lesser teams on occasions when we've scored first!
Follow along with the video below to see how to install our site as a web app on your home screen.
Note: This feature may not be available in some browsers.
All advertisments are hidden for logged in members, why not log in/register?
View attachment 5357
Right! I've made the trend line 'polynomial' (me neither) and it appears to work...
is Mr Grafikhaus related to Lewis or Duckworth
football is simple , 2 points per game means going up
Surely the graph should start at zero points and zero games this one starts at zero points but at game #1View attachment 5357
Right! I've made the trend line 'polynomial' (me neither) and it appears to work...
The problem is that the X axis labels do not begin at 0.
Grafikhuas sent me his spreadsheet earlier, and i present it here to you in what i believe to be the correct from (This is after a a few whiskys though....)
View attachment 5359
OK, Iwas on the wife beater last night, but surely he trendline is a regression line, a line of best fit. It's aim is to get the minimum error between itself and the data and then extrapolate forward, not take the average and extrapolate forward. 2 different methods hence 2 different results?
UTB
Surely the graph should start at zero points and zero games this one starts at zero points but at game #1
is Mr Grafikhaus related to Lewis or Duckworth
football is simple , 2 points per game means going up

Can I just suggest that this is all very simple.
To get the "trend line" all you have to do is divide points gained by games played and multiply by 46 - that will tell you how many points you will get at the end of the season if the trend continues.
This wholel thread is a wonderful example of the ability of technology to make a straightfoward thing very complicated....
Count the columns along the horizontal by starting at 1 you have 45 not 46 games.
That's because the games played figures are represented by the lines not the columns: games played are absolutes. There should be 46 vertical lines.
Quite simple really, if you are building a fence with 46 panels you need 47 fence poles trust a university graduate to make a program that complicates something a 5yr old could work out in his head.That's because the games played figures are represented by the lines not the columns: games played are absolutes. There should be 46 vertical lines.
Quite simple really, if you are building a fence with 46 panels you need 47 fence poles trust a university graduate to make a program that complicates something a 5yr old could work out in his head.
Get more points than anyone else then we get promoted.
Get 2nd most points and we get promoted.
Nothing else matters because if we finish outside that we will fail.
Are you seriously suggesting that, should we finish outside the top two places, you are less than confident we will be victorious in the play offs?
We have been in 4 play off finals and lost all of them. Assuming a 50-50 chance of winning each one, the chances of losing all 4 are 1 in 16. That must mean we will win the next one.... doesn't it?

There's 1% missing from that diagram HB
All advertisments are hidden for logged in members, why not log in/register?
