Compared with last season...

All advertisments are hidden for logged in members, why not log in/register?

Makes interesting reading that. I could write two paragraphs here but lets save my time writing and your time reading and agree to disagree about whether we were unlucky or not. I dont necessarily see it as black and white but at the end of the day we were 3rd after everyone had played 46 games. No one outside of the Sheffield clubs will ever look back at that league table and wonder why. It feels like I'm talking about our relegation from the top flight again but we were in 2nd place with two games left. All we had to do was beat Stevenage and Exeter with all due respect to them and we couldn't bring it home.
 

Makes interesting reading that. I could write two paragraphs here but lets save my time writing and your time reading and agree to disagree about whether we were unlucky or not. I dont necessarily see it as black and white but at the end of the day we were 3rd after everyone had played 46 games. No one outside of the Sheffield clubs will ever look back at that league table and wonder why. It feels like I'm talking about our relegation from the top flight again but we were in 2nd place with two games left. All we had to do was beat Stevenage and Exeter with all due respect to them and we couldn't bring it home.

Couldn't resist the last word though could you?! ;) Better to discuss over a beer some time. Mind you, I am still waiting for that ale you promised, after you bailed the last time!? :p
 
Couldn't resist the last word though could you?! ;) Better to discuss over a beer some time. Mind you, I am still waiting for that ale you promised, after you bailed the last time!? :p

I was just having that much fun I didn't want the debate to end :)

Seriously though I wasn't trying to have the final word, you have your opinion and I have mine. I know a number of people who would agree with you on last season and disagree with me. I just think after years of disappointment it cant be bad luck every time. I used to have a rose tinted view about the Blades when I was a little younger and genuinely believed that we were the unluckiest team in the world. They've knocked that out of me now. Perhaps its the humbling status of being a third division club I dont know....I just get fed up of looking for reasons or excuses for why they fail to live up to expectation.

Indeed I do owe you a pint of real ale. Let me know the next time you're going t'lane. I get to most home games but have missed a few so far this season for one reason or another.
 
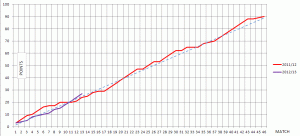
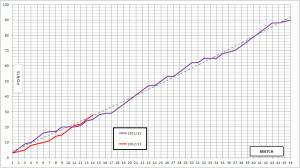
That's Match 12 (Oldham) over. Bollocks.

View attachment 5342

Not good. Just a whisker away from being well into the range I quoted, in terms of predicted points. Saturday was very disappointing, but if you actually do a direct comparison then we gained a point (compared with that infamous defeat of last year).
 
seems a large fluctuation 8/9 points over 1 result

as I said steady as we go, win one draw 1 2 points per game
wait for your tranmeres to level out to reality
 
Cracking result today. Now two very winnable home games. We really need to beat Walsall and Pompey and turn the screw on Tranmere.
 
Be wary of this "very winnable" tosh. Walsall have been playing some good stuff and started the season well. I think we're playing them at a good time as they've gone off the boil last three or four games.

As for Portsmouth, they're not far off the play-offs despite all their off field issues and they're unbeaten in five (four wins).

If we can't beat Oldham, Bury or Burton Albion at home, I can't see us just turning up and easily beating this lot.
 
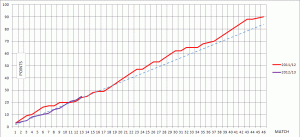
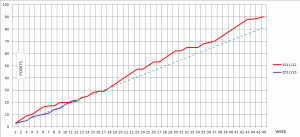
True. How, I just don't know, but true. This is after Match 14 (Walsall) and the 'trend line' is moving towards the 90 points mark. Just don't ask me how!

View attachment 5355

Surely the trend line is to 92 points. We now have 28 from 14 games - i.e. 2 points a game, keep that up and we will end up with 92.
 

Surely the trend line is to 92 points. We now have 28 from 14 games - i.e. 2 points a game, keep that up and we will end up with 92.
I thought that too, but he said not to ask :D So I didn't.
 
Surely the trend line is to 92 points. We now have 28 from 14 games - i.e. 2 points a game, keep that up and we will end up with 92.

and...

I thought that too, but he said not to ask :D So I didn't.

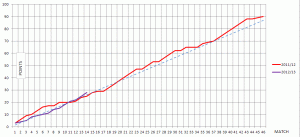
All very true. The data gridlines don't intersect the exact data information (i.e. match 10 data falls between gridlines and the graph lines don't begin at exactly zero).

Any Excel buffs help with this?
 
and...


All very true. The data gridlines don't intersect the exact data information (i.e. match 10 data falls between gridlines and the graph lines don't begin at exactly zero).

Any Excel buffs help with this?

Call me stupid, but I though the point of technology was to make life easier. Here we have a situation where some basic mental arithmatic can tell you what the trend is, yet your whizzy graph can't cope with that...
 
and...
All very true. The data gridlines don't intersect the exact data information (i.e. match 10 data falls between gridlines and the graph lines don't begin at exactly zero).

Any Excel buffs help with this?

Assuming you're running Excel 2007: Right click on the axis, select "Format Axis", select the "On Tick Marks" option under Position Axis at the bottom.

Darren : you're correct but so is the trendline; at the lowest x value (1) the y value is 3 where it should be coming from the origin. grafikhaus you may need to add in 0 games, 0 points to make it more accurate.
 
I am afraid I don't understand a word of that...

OK:
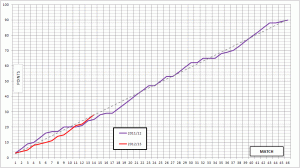
The horizontal (x) axis has the number of games played; the vertical (y) axis the number of points.

At the first point on the chart x=1, y=3. After last night's game x=14, y=28.

x has increased by 13 and y by 25. The trendline formula is therefore y=((25/13)*x)+3 and so at x = 46 it should be projecting y = 91.5 ((25/13 * 46) +3 )

The +3 comes from the fact that the first point on the chart is at (1,3) not (0,0)

Clear as mud, right?

So:

On the one hand we can calculate how many points United will end up with if they carry on with the same form by doing a simple sum: 2 x 46 = 92.

Or on the other hand, we can calculate it using an inccaurate graph and a complicated mathematical formula to get basically the same result.

Hmm...
 
So:

On the one hand we can calculate how many points United will end up with if they carry on with the same form by doing a simple sum: 2 x 46 = 92.

Or on the other hand, we can calculate it using an inccaurate graph and a complicated mathematical formula to get basically the same result.

Hmm...

The inaccuracy of the graph is behind the inaccuracy of the trendline. Get ze head right and ze rest will follow, as they say.
 
So:

On the one hand we can calculate how many points United will end up with if they carry on with the same form by doing a simple sum: 2 x 46 = 92.

Or on the other hand, we can calculate it using an inccaurate graph and a complicated mathematical formula to get basically the same result.

Hmm...

I'm afraid the GIGO principle is in operation here. Garbage In, Garbage Out.

either that or PEBKAC, after all I very much doubt that Excel can't cope with a simple trend analysis in graph form...
 

All advertisments are hidden for logged in members, why not log in/register?

All advertisments are hidden for logged in members, why not log in/register?

Back
Top Bottom