Compared with last season...

All advertisments are hidden for logged in members, why not log in/register?

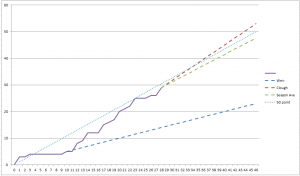
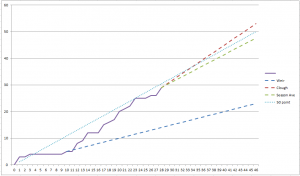
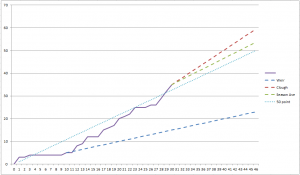
Our current projected points is 48, but I think this is slightly misleading as it includes Weir’s results. Under Clough we he have picked up 20 points from 15 games (W5, D5, L5) meaning we have a 1.33 points per game average. Extrapolating over the remaining games would mean we pick up 24 points. This gives us a projected points tally of 52. Fancy adding that to your chart grafikhaus ? :)
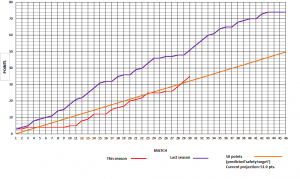
Ah, if only someone had already done a chart to demonstrate this...
Capture.PNG
 

I think it is harsh to say that we faded out 2nd half verse Shrewsbury. Whilst it would have been nice to have panned them, we shut up shop and played out the game professionally.

So we're all bloody stattos now, are we? :D

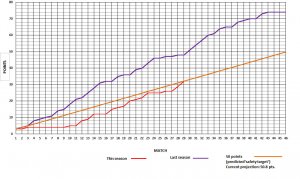
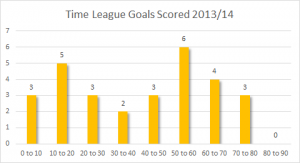
All correct, Ollie. I just put the charts up after the match and added a bit of dialogue. Then went to the pub. The fact that NC has given the players 2 days off as 'they're running on empty' proves the reason for the 'fade out'. HOWEVER after 28 games, it seems incredible that we haven't managed a single goal in the last 10 minutes of a fixture. We've lost seven League games by a single goal and drawn eight. Think how better our position would be if we'd have 'sneaked' the odd late goal in any of those games...
 
I think it is harsh to say that we faded out 2nd half verse Shrewsbury. Whilst it would have been nice to have panned them, we shut up shop and played out the game professionally. They came out up for it 2nd period and we nullified them. I was pleased with that. We had chances and could have scored 2nd half (plus there was Porter’s disallowed goal).

Got to agree we were professional plus have a game wednesday night at home against top of the league and there game was off so extra rest, i think there was one eye on that game to.
 
I love this stuff. But the key question is can we still make the play-offs? We'd only need to raise our PPG to 2.5 ish for the rest of the season:D
 
Saturday was the most comfortably they've won by in a while. last team we did that to in the league was Tranmere at home. Not sparkling by any stretch of the imagination, but they got a solid win and a clean sheet, and we've not had nearly enough of them this season.
 
It could finally be coming together. A difficult midweek game - as Pinchy said - 'Gillingham are horrible physical giants.'
(possibly preparing for Wendy in the Cup? :) Nah, he didn't mention 'dirty bastards'.)

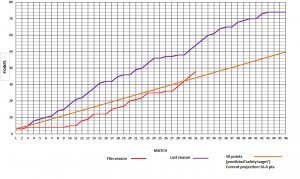
Anyway, job done and - for the first time - we're above the nominal '50 point safety margin'.

29win.jpg
FWIW here's the latest 'time scored' chart:

upload_2014-2-20_7-45-15.png
 
It could finally be coming together. A difficult midweek game - as Pinchy said - 'Gillingham are horrible physical giants.'
(possibly preparing for Wendy in the Cup? :) Nah, he didn't mention 'dirty bastards'.)

Anyway, job done and - for the first time - we're above the nominal '50 point safety margin'.

View attachment 7319
FWIW here's the latest 'time scored' chart:


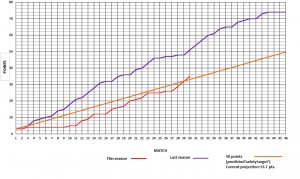
It goes without saying, but I'll say it anyway, the last 2 results have provided an unbelievably important 6 points, and this graph shows quite clearly that league safety is realistic. Games in hand too...... Bravo, United. Bravo
 
Strange the way this season and last are beginning to mirror each other, all be it this season is at a lower level...
 
Would be even betterer if the line was actually on 53.7 instead of just 50. ;)
 

No - the safety line is just right!! Graffers, how do you calculate the current projection? I presume it's form all season rather than current form?
 
No - the safety line is just right!! Graffers, how do you calculate the current projection? I presume it's form all season rather than current form?

Yes, it's based on form all season.
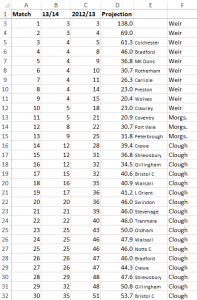
upload_2014-2-23_7-20-2.png

It's a Microsoft Excel spreadsheet. 'Match' is Column A, '13/14' is Column B, '2012/13' (last season) is Column C and 'Projection' is Column D.

The 'Projection' is calculated =SUM(B32/A32*46) That was, for example, yesterday's game fell into Row 32* so it was 51 (points after 30 games last season) ÷ 35 (points after 30 games this season) x 46 (number of matches in a season). Not so simple, unfortunately as these calculations use an order of precedence called BODMAS.

* because headings such as Match, Projection etc. took up a couple of rows ∴ the 'Match' is a couple of rows out.

Strange the way this season and last are beginning to mirror each other, all be it this season is at a lower level...

When Weir thankfully left after Game 10 we had five points. After 10 games last season (by no means a blistering start), we'd got 18 points. So, while thanking Weir for his 'efforts' and assuming we'd got a nominal extra 13 points without these 'efforts', we'd now be on 48 points and seventh in the table. So, thanks again David and hope you're pleased with your compensation...

Oh, and it's albeit. ;)

Would be even betterer if the line was actually on 53.7 instead of just 50. ;)

Wrong!

Crossed the line for the first time this season
No, that was after the last game v. Gillingham (50.8 pts. projection).

Where's the predicted play off line though?

Hopefully, you're joking! However I don't want to see a 'projection' line of 50 ever again!
 
Last edited:
grafikhaus one slight change - the safety line should start at the origin (0,0) so after 1 game it should be at 50/46 (1,1.087). You've got it starting at (1,3) which is why it looks like the line for this season didn't pass until Bristol rather than Gillingham.

Hope that makes sense?

PS that also means that we were ahead of the safety line under Weir for two games :)
 
Judging by the difference between the two managers results, it makes you wonder where we would be now if we had started the season with Nigel, dunit.....
 

All advertisments are hidden for logged in members, why not log in/register?

All advertisments are hidden for logged in members, why not log in/register?

Back
Top Bottom