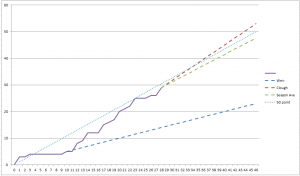
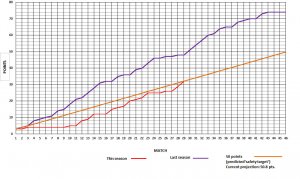
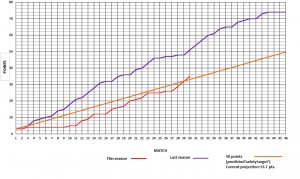
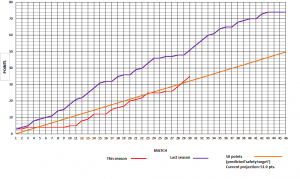
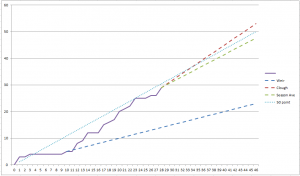
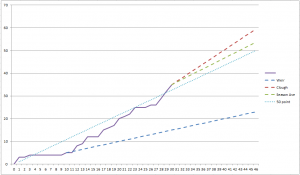
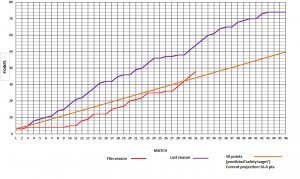
No - the safety line is just right!! Graffers, how do you calculate the current projection? I presume it's form all season rather than current form?
Yes, it's based on form all season.
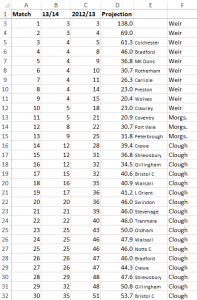
It's a Microsoft Excel spreadsheet. 'Match' is Column A, '13/14' is Column B, '2012/13' (last season) is Column C and 'Projection' is Column D.
The 'Projection' is calculated =SUM(B32/A32*46) That was, for example, yesterday's game fell into Row 32* so it was 51 (points after 30 games
last season) ÷ 35 (points after 30 games
this season) x 46 (number of matches in a season). Not so simple, unfortunately as these calculations use an order of precedence called
BODMAS.
* because headings such as Match, Projection etc. took up a couple of rows ∴ the 'Match' is a couple of rows out.
Strange the way this season and last are beginning to mirror each other, all be it this season is at a lower level...
When Weir thankfully left after Game 10 we had five points. After 10 games
last season (by no means a blistering start), we'd got 18 points. So, while thanking Weir for his 'efforts' and assuming we'd got a nominal extra 13 points without these 'efforts', we'd now be on 48 points and seventh in the table. So, thanks again David and hope you're pleased with your compensation...
Oh, and it's
albeit. 
Would be even betterer if the line was actually on 53.7 instead of just 50.

Wrong!
Crossed the line for the first time this season
No, that was after the last game v. Gillingham (50.8 pts. projection).
Where's the predicted play off line though?
Hopefully, you're joking! However I don't want to see a 'projection' line of 50 ever again!

