ucandomagic
Well-Known Member
The excitement has started to build, now that we have all of our fixtures for next season!
So - I can come out of my graph-withdrawal period and get plotting!
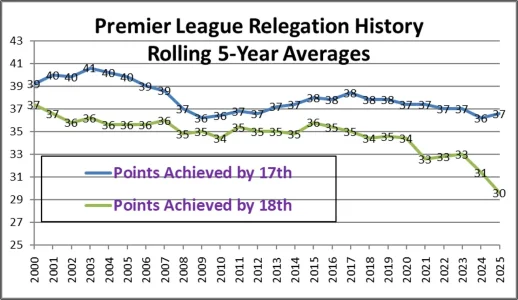
First of all - a reminder of what we have avoided! Graph 1 shows a 5-year rolling average of the points achieved by 17th and 18th place in the Premier League. When you plot individual years there is a lot of noise, but when you plot 5-year rolling averages it highlights real trends. I find Graph 1 interesting, because if at you look at the rolling 5-year average points for 17th over the last 15 years there is very little fluctuation (36-38 points). However, over that period the rolling 5-year average for 18th has fallen away dramatically, from about 35, right down to a 5-year average of less than 30 over the last 5 years. So, it's not that the survival total has gone up, just that the bottom 3 are sinking further away from achieving it! At least we won't be contributing to lowering that figure next season!!
Graph 1:

Anyway, on to our prospects for next season. As usual, I'll post some graphs each week following our progress, and they will hopefully be pictures that "paint a thousand words".
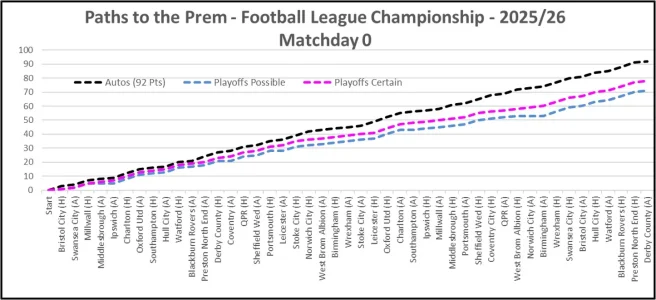
Graph 2 will compare our progress against 3 benchmark sets of results. I've taken each match and created 3 sets of results to achieve 3 points totals, which should represent Automatic Promotion (92), Playoff Certainty (78) and Playoff Possibility (71). My benchmarks take account of who our opponents are each week, so my line is my forecast for the easiest way that we could achieve those 3 points totals. Obviously, 92 was nowhere near automatic promotion last season - so I may well have to adjust that if this season progresses in a similar way to last season. I'll plot Ruben's Blades against these benchmarks, and probably the Wendy line as well (just for a laugh)!
Graph 2:

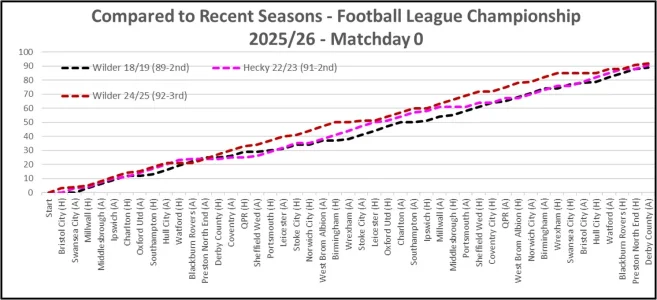
Graph 3 will compare this season against 3 of our recent Championship seasons, in 2018/19, 2022/23 and 2024/25. These earlier season results are the results from the same game day – not the same opponents. I'd love to watch us come top at this level - as winning the 2 levels below are some of my best memories. Actually, Darlington is a bit of a blur for me (almost a blank actually!). I've removed the 2-point deduction from last season, as the idea of this graph is a comparison of form on the pitch, not in the Boardroom!
Graph 3:

So, roll-on August 9th - let's make it a hat-trick of 3-0's against what are now Struber's Robins. Actually, before that I'm looking forward to July18th/19th, as I'm going to watch the 21's at sunny Dronfield on 18th, staying over at Hunters Bar and then going to watch Ruben's boys for the first time against the Millers on 19th. The game against Club could be interesting if some of our Bulgaribot children are out for a run, and then Rotherham will be interesting to see how Ruben sets the first team up.
Yippee!! - Footie is nearly back!
UTB & Slava Ukraini!
So - I can come out of my graph-withdrawal period and get plotting!
First of all - a reminder of what we have avoided! Graph 1 shows a 5-year rolling average of the points achieved by 17th and 18th place in the Premier League. When you plot individual years there is a lot of noise, but when you plot 5-year rolling averages it highlights real trends. I find Graph 1 interesting, because if at you look at the rolling 5-year average points for 17th over the last 15 years there is very little fluctuation (36-38 points). However, over that period the rolling 5-year average for 18th has fallen away dramatically, from about 35, right down to a 5-year average of less than 30 over the last 5 years. So, it's not that the survival total has gone up, just that the bottom 3 are sinking further away from achieving it! At least we won't be contributing to lowering that figure next season!!
Graph 1:

Anyway, on to our prospects for next season. As usual, I'll post some graphs each week following our progress, and they will hopefully be pictures that "paint a thousand words".
Graph 2 will compare our progress against 3 benchmark sets of results. I've taken each match and created 3 sets of results to achieve 3 points totals, which should represent Automatic Promotion (92), Playoff Certainty (78) and Playoff Possibility (71). My benchmarks take account of who our opponents are each week, so my line is my forecast for the easiest way that we could achieve those 3 points totals. Obviously, 92 was nowhere near automatic promotion last season - so I may well have to adjust that if this season progresses in a similar way to last season. I'll plot Ruben's Blades against these benchmarks, and probably the Wendy line as well (just for a laugh)!
Graph 2:

Graph 3 will compare this season against 3 of our recent Championship seasons, in 2018/19, 2022/23 and 2024/25. These earlier season results are the results from the same game day – not the same opponents. I'd love to watch us come top at this level - as winning the 2 levels below are some of my best memories. Actually, Darlington is a bit of a blur for me (almost a blank actually!). I've removed the 2-point deduction from last season, as the idea of this graph is a comparison of form on the pitch, not in the Boardroom!
Graph 3:

So, roll-on August 9th - let's make it a hat-trick of 3-0's against what are now Struber's Robins. Actually, before that I'm looking forward to July18th/19th, as I'm going to watch the 21's at sunny Dronfield on 18th, staying over at Hunters Bar and then going to watch Ruben's boys for the first time against the Millers on 19th. The game against Club could be interesting if some of our Bulgaribot children are out for a run, and then Rotherham will be interesting to see how Ruben sets the first team up.
Yippee!! - Footie is nearly back!
UTB & Slava Ukraini!


