I should coco
A little harsh on a well meaning body of men
Graph of my weight loss since just after start of season.
Is the Y-axis in Stones or Tonnes?
Follow along with the video below to see how to install our site as a web app on your home screen.
Note: This feature may not be available in some browsers.
All advertisments are hidden for logged in members, why not log in/register?
Graph of my weight loss since just after start of season.
Wolves 103 in L1 a couple of seasons ago.What's the record highest number of points in this league? In any league?
Just curious.
http://www.fl125.co.uk/records/league-pointsWolves 103 in L1 a couple of seasons ago.
I think the record is 106 held by Reading coming out of the Championship in 05/06
Link needs updating then!Where are Wolves?
The chart of how every one stood. Column A is number of points after 26 games, Column B is how they went on in game 27, Column C is their final points total.
View attachment 21898
RobsonNot sure if this has been posted, but our next win will equal the total number of league wins for the entirety of last season. Well done to Wilder et al of course but also highlights what an unmitigated disaster Nigel Adkins was for this football club. I'm struggling to think of a bigger expectation vs outcome shortfall!
is second place do able just to check on the points required to go up autoThis is the comparable after Saturday:
View attachment 21897
The chart of how every one stood. Column A is number of points after 26 games, Column B is how they went on in game 27, Column C is their final points total.
View attachment 21898
The chart of how every one stood. Column A is number of points after 26 games, Column B is how they went on in game 27, Column C is their final points total.

so the most we can get is 117 points, thats disappointing
lucky sods doncaster and southend winning league on 82 and 84 points
if it was possible this is enough we only 9 wins
strange
how 84 was enough one season then 103 the next

Clearly the reason we didn't go up in 11/12 was we were a blue line. This year we're a red line. Problem solved. grafikhaus - solving promotion conundrums since 1889OK. A change of pace. While I think it has been useful to compare this season to last, we're now only 6 points off our total for last year. This season is shaping up to be our best for a few years, last season was our worst finish since 1985 so comparisons are a bit futile.
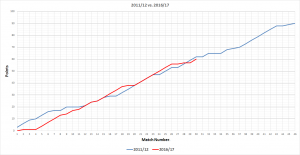
Surely it's a better indication of our progress to compare this season with 2011/12, (no-show in the final v. Huddersfield, Chedgate etc)? That year we finished on 90 points - probably enough to secure a place in the autos this season. After 30 matches, we're only 2 points worse off than 2011/12, but we were about to have a 'mini blip' of only 3 points out of 12, or 8 points out of a possible 21.
View attachment 22938
I almost made that suggestion last night! Great minds, eh?OK. A change of pace. While I think it has been useful to compare this season to last, we're now only 6 points off our total for last year. This season is shaping up to be our best for a few years, last season was our worst finish since 1985 so comparisons are a bit futile.
Surely it's a better indication of our progress to compare this season with 2011/12, (no-show in the final v. Huddersfield, Chedgate etc)? That year we finished on 90 points - probably enough to secure a place in the autos this season. After 30 matches, we're only 2 points worse off than 2011/12, but we were about to have a 'mini blip' of only 3 points out of 12, or 8 points out of a possible 21.
View attachment 22938
Best bits of that are us at the top and Chessie and Cov at the bottom.Run in relative strength table after the last few games. As noted elsewhere, Southend appear to have played many of the top teams and have a relatively easier run in...
View attachment 22977
All advertisments are hidden for logged in members, why not log in/register?
