Compared with last season...

All advertisments are hidden for logged in members, why not log in/register?


Another 'interesting' stat is if you compare our results this season with the same fixtures from last season (and use an average for the promoted and relegated teams and their replacements) we are around 12 points better off
 
And here the champions of the league comparator:

upload_2016-11-23_11-51-56.png

High: 43 (Charlton 2012)
Low: 32 (Norwich 2010, Scunthorpe 2007)
 
Good conversion rate by Peterborough...

The most encouraging thing in that graphic is that we actually allowed the lowest expected goals (and kept a clean sheet in real life).
 
[
Slipped a couple of points behind Northampton last season over the last couple of weeks but Tufty's returns for both years are still remarkably similar.

Let's hope we're as close after 92 games as we are after 21.

UTB

Northampton Comparison.jpg
 
I meant 46 games in the above - I'm just obsessed with aiming for an average of 2 points a game to get 92 at the end of the season!

UTB
 

I meant 46 games in the above - I'm just obsessed with aiming for an average of 2 points a game to get 92 at the end of the season!

UTB

An easy mistake to make - leave these graphs to the professionals, son. ;)

Win at Coventry on Thursday and we're exactly on course for 92 points. :)
 
You know what is interesting? This time 5 years ago we had 41 pts, we'd scored 38 and conceded 22 goals. We are bang on where we were in the season we finished third.
 
OK Dad!

Interesting also to compare Clough's 2 seasons with this season as well as Madkins' seaon.

UTB


View attachment 21090

Christ, I hadn't realised that the points total last season was worse than the season 2 before, when we had THAT start under Weir. Well done Adkins - you got a lower points total than when we had 1 win after 11 games. Bravo you fucking clown.
 
So this is the 11 year comparable for the divisional winners after 21 games:
upload_2016-12-12_12-30-21.png

High: 48 - Charlton (2012)
Low: 35 - Southend (2006)
 
A side-by-side analysis of the Top 8 from 2011/12 against this season after 21 games:
upload_2016-12-12_15-10-10.png

In 2011/12 the top 8 had accumulated 308 points after 21 games, the current table has 289 (292 obviously if Peterborough win their game in hand).
 
A side-by-side analysis of the Top 8 from 2011/12 against this season after 21 games:
View attachment 21120

In 2011/12 the top 8 had accumulated 308 points after 21 games, the current table has 289 (292 obviously if Peterborough win their game in hand).

Its a lovely table, which somewhat ignores the fact that Bolton have played only 20 games (until tonight)...
 
If Bolton win their game in hand we're in the same position too but this year it's time to smash the hoodoo!
 
the 11 12 season was very unusual in points spread

obviously the more drawn games the less points available to share around

with no draws there 1656 points available across league 1....46 x 12 x 3
all games drawn gives 1112
obviously it naturally falls between 1300 and 1450
but across a division it could be 150 points less shared around if there are a lot of draws
thats when 88 can win the title as doncaster did
less draws in 2011 meant the ridiculously high points
 
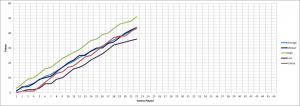
Comparables for last 11 years.

upload_2016-12-16_11-23-10.png

High - 2012 - 51 - Charlton
Low - 2006 - 36 - Southend

Worth pointing out that the next 6 games are where the clubs who have won the division have really kicked on. The worst was Wigan last season but they still took 12 points from 18 in games 23 to 28 (and were unbeaten - and they also won games 29 and 30)
 

All advertisments are hidden for logged in members, why not log in/register?

All advertisments are hidden for logged in members, why not log in/register?

Back
Top Bottom