ucandomagic
Well-Known Member
On my graph threads I use an Automatic Promotion benchmark set of results for the season which was originally targeted at 90 points but was recently increased to 92 points to reflect the level of competition between the Top 4. I said, when I inceased it, that I would have a deeper look at the data, as there was certainly an indication that the general situation was changing with an increasing gulf between better and lesser teams and a resulting increase in the top teams' points totals.
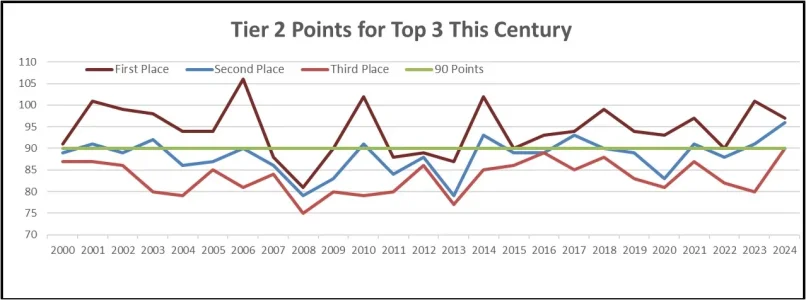
Graph 1 shows all of the Top 3's points totals this century, along with a 90-point line.
Only once has a team got 90 points and not been Top 2 - but that was Leeds last year!
Graph 1:

Leicester were top with 97, Ipswich second with 96 and Leeds third with 90. So 90 points (or even 92 points) was nowhere near enough for Top 2 last year.
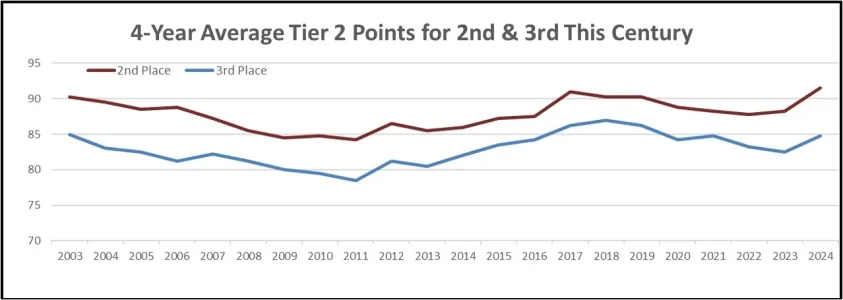
I wondered, therefore, whether this was a recent developing trend, so Graph 2 shows the 4-year rolling average totals this century for second and third place. There is a perceptible rise from about 2011 to 2018 or 2019 but then, of course Covid changed many things and undoubtedly affected results. There is, though, a strong upturn for 2024.
Graph 2:

So the next question is whether 2024 was an outlier or the start of a step-changed scenario. Table 1 shows the top of the 2024 and 2025 tables at the present moment - 30 games in. There is an uncanny similarity, with 4 teams pulling away this year and a 13-point gap to 5th. Last year 4 teams had pulled away with an 11 point gap to 5th, although some had only played 29 games.
Table 1:

Table 2 shows the very end of last season - with the same 4 teams having remained ahead, now with a 12-point gap back to 5th.
Table 2:

So the evidence does support the idea that, in the current competitive environment, a small group of teams will become significantly stronger and pull away, getting higher points totals than historically recorded. To quote Henry Ford "History is more or less bunk"!
All of the above implies that only the very recent past is relevant - Leeds would probably have needed 96 or 97 points to be second last year - and this year is looking very similar to last year.
So, I took the Top 4 and applied an optimistic, but not unrealistic look at all of their remaining fixtures. This resulted in Leeds 97, Blades 97, Sunderland 96, Burnley 94.
In other words, 97 points could realistically be required for second place.
I will continue to monitor everybody's results against the 4 sets of updated "optimistic" forecasts and report each week on how I think the end target is changing. There is, of course, a psychological aspect, if a team starts to fall away and lose confidence or vice versa. I must admit, though, that Sunderland have been a lot more robust than I expected as the pressure has increased.
So the cold analyst in me says 93 points will be enough but, at the moment, the Blade in me says expect to need 97!
UTB & Slava Ukraini!
Graph 1 shows all of the Top 3's points totals this century, along with a 90-point line.
Only once has a team got 90 points and not been Top 2 - but that was Leeds last year!
Graph 1:

Leicester were top with 97, Ipswich second with 96 and Leeds third with 90. So 90 points (or even 92 points) was nowhere near enough for Top 2 last year.
I wondered, therefore, whether this was a recent developing trend, so Graph 2 shows the 4-year rolling average totals this century for second and third place. There is a perceptible rise from about 2011 to 2018 or 2019 but then, of course Covid changed many things and undoubtedly affected results. There is, though, a strong upturn for 2024.
Graph 2:

So the next question is whether 2024 was an outlier or the start of a step-changed scenario. Table 1 shows the top of the 2024 and 2025 tables at the present moment - 30 games in. There is an uncanny similarity, with 4 teams pulling away this year and a 13-point gap to 5th. Last year 4 teams had pulled away with an 11 point gap to 5th, although some had only played 29 games.
Table 1:

Table 2 shows the very end of last season - with the same 4 teams having remained ahead, now with a 12-point gap back to 5th.
Table 2:

So the evidence does support the idea that, in the current competitive environment, a small group of teams will become significantly stronger and pull away, getting higher points totals than historically recorded. To quote Henry Ford "History is more or less bunk"!
All of the above implies that only the very recent past is relevant - Leeds would probably have needed 96 or 97 points to be second last year - and this year is looking very similar to last year.
So, I took the Top 4 and applied an optimistic, but not unrealistic look at all of their remaining fixtures. This resulted in Leeds 97, Blades 97, Sunderland 96, Burnley 94.
In other words, 97 points could realistically be required for second place.
I will continue to monitor everybody's results against the 4 sets of updated "optimistic" forecasts and report each week on how I think the end target is changing. There is, of course, a psychological aspect, if a team starts to fall away and lose confidence or vice versa. I must admit, though, that Sunderland have been a lot more robust than I expected as the pressure has increased.
So the cold analyst in me says 93 points will be enough but, at the moment, the Blade in me says expect to need 97!
UTB & Slava Ukraini!
