ucandomagic
Well-Known Member
I waited to post this until I had full XG data, in order to add, perhaps, just a little light on the horizon!
So, what to say about the Millwall game? We were pretty dire all over the pitch. There seems to be little justification at present for starting Cannon, but absolutely no justification for starting him out wide. Also, I don’t think that we should be playing Seriki and Burrows in a back 4 – neither are up to it defensively. Burrows is great going forwards (as is Seriki) but is completely indisciplined as a defender. For Millwall’s goal Burrows was sucked into the centre, interfered with Bindon challenging for a header while leaving his man Cundle unmarked for a tap in. This is so similar to Sunderland’s first goal at Wembley, when Burrows had Mayenda covered but again got sucked into the centre, where the play was already covered, leaving a wide open space in front of Mayenda for the ball to be passed into, which Robinson couldn’t cover. Rube needs to match his formation and tactics to who is available to him, rather than to how he would like to play. Hopefully, a few of the recent incomings will help to close that gap between desire and reality.
OK, and so to the graphs, which will follow and compare our progress with targets and with previous history.
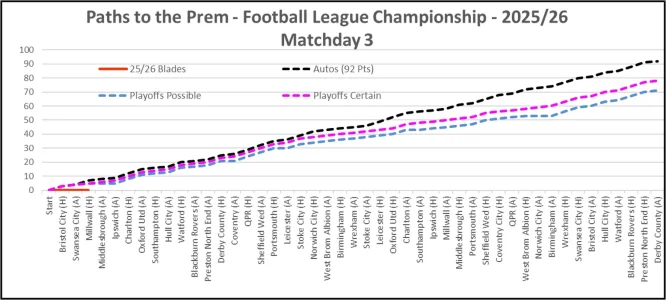
Graph 1 will compare our progress against 3 benchmark sets of results. I've taken each match and created 3 sets of results to achieve 3 points totals, which should represent Automatic Promotion, Playoff Certainty and Playoff Possibility. My benchmarks take account of who our opponents are each week. Graph 1 shows that, compared to my benchmarks, we are probably 5 or 6 points behind where we would like to be, especially with 2 tough games coming up. Enough said!
Graph 1:

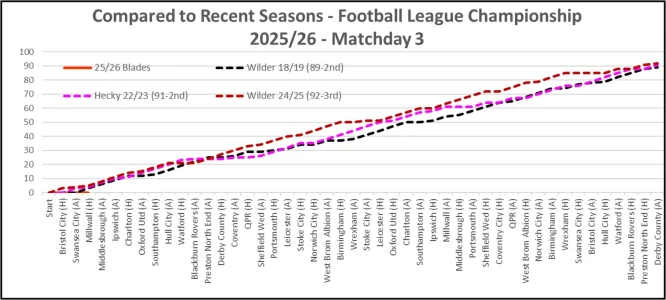
Graph 2 will compare this season against our 3 recent Top 3 finishes at this level ( in 2018/19, 2022/23 and last season). For last season I’m using the actual 92 points earned, without the deduction, as the purpose is to compare form. These earlier season results are the results from the same game day – not the same opponents. Graph 2 shows that the previous low in these seasons was the 3 points that we had in 2018/19 under Wilder. (For reference, in Slav’s season we had 1 point from our first 3 games and 2 points from 5 games.)
Graph 2:

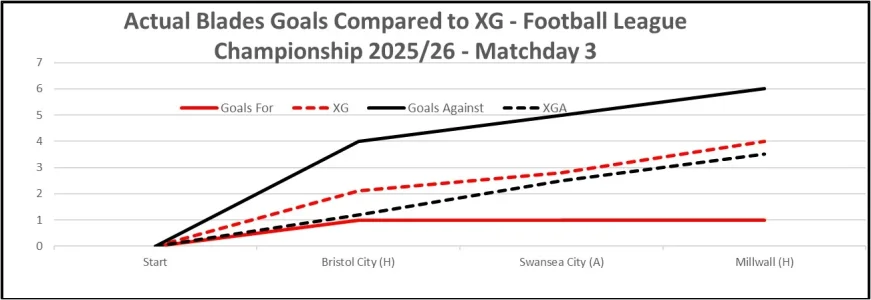
Trying to add some optimism to the proceedings, in Graph 3 I’ve had a first look at XG data. In our first 3 games we have scored 1 and conceded 6 – however XG says that we should probably have scored 4 (4.0) and conceded 4 (3.5). So our performances have been those of a mid-table 55-60 point team, not of a rock-bottom team.
Graph 3:

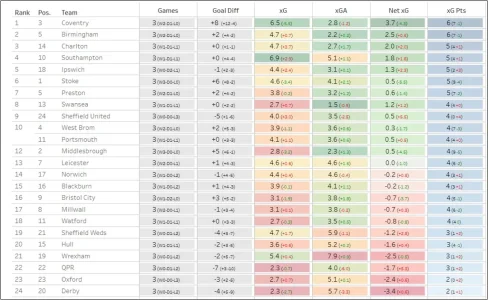
Graph 3 is supported by Table 1 below, the actual XTable from footballxg.com. Table 1 has us in 9th place, so slightly better than the mid-table performer that I suggested above.
Table 1:

Moving on to our next game against Boro, XG would probably suggest a 1-1 draw. However, Boro have been outscoring XG and we have been doing the opposite, so results would suggest a 2-1 or 2-0 win for Boro. Hopefully, though, our new additions can get us our first points on the board.
Overall then, we have unquestionably been disappointing, but we are now bringing in enough CB’s to form an American Football Defensive Line, Ings for real support and load-sharing with Campbell, and the data suggests that our play this far has actually deserved better outcomes.
I posted my pre-season forecast of a 3rd place finish a couple of weeks, ago and I am still quietly confident that we can achieve that.
UTB & Slava Ukraini!
So, what to say about the Millwall game? We were pretty dire all over the pitch. There seems to be little justification at present for starting Cannon, but absolutely no justification for starting him out wide. Also, I don’t think that we should be playing Seriki and Burrows in a back 4 – neither are up to it defensively. Burrows is great going forwards (as is Seriki) but is completely indisciplined as a defender. For Millwall’s goal Burrows was sucked into the centre, interfered with Bindon challenging for a header while leaving his man Cundle unmarked for a tap in. This is so similar to Sunderland’s first goal at Wembley, when Burrows had Mayenda covered but again got sucked into the centre, where the play was already covered, leaving a wide open space in front of Mayenda for the ball to be passed into, which Robinson couldn’t cover. Rube needs to match his formation and tactics to who is available to him, rather than to how he would like to play. Hopefully, a few of the recent incomings will help to close that gap between desire and reality.
OK, and so to the graphs, which will follow and compare our progress with targets and with previous history.
Graph 1 will compare our progress against 3 benchmark sets of results. I've taken each match and created 3 sets of results to achieve 3 points totals, which should represent Automatic Promotion, Playoff Certainty and Playoff Possibility. My benchmarks take account of who our opponents are each week. Graph 1 shows that, compared to my benchmarks, we are probably 5 or 6 points behind where we would like to be, especially with 2 tough games coming up. Enough said!
Graph 1:

Graph 2 will compare this season against our 3 recent Top 3 finishes at this level ( in 2018/19, 2022/23 and last season). For last season I’m using the actual 92 points earned, without the deduction, as the purpose is to compare form. These earlier season results are the results from the same game day – not the same opponents. Graph 2 shows that the previous low in these seasons was the 3 points that we had in 2018/19 under Wilder. (For reference, in Slav’s season we had 1 point from our first 3 games and 2 points from 5 games.)
Graph 2:

Trying to add some optimism to the proceedings, in Graph 3 I’ve had a first look at XG data. In our first 3 games we have scored 1 and conceded 6 – however XG says that we should probably have scored 4 (4.0) and conceded 4 (3.5). So our performances have been those of a mid-table 55-60 point team, not of a rock-bottom team.
Graph 3:

Graph 3 is supported by Table 1 below, the actual XTable from footballxg.com. Table 1 has us in 9th place, so slightly better than the mid-table performer that I suggested above.
Table 1:

Moving on to our next game against Boro, XG would probably suggest a 1-1 draw. However, Boro have been outscoring XG and we have been doing the opposite, so results would suggest a 2-1 or 2-0 win for Boro. Hopefully, though, our new additions can get us our first points on the board.
Overall then, we have unquestionably been disappointing, but we are now bringing in enough CB’s to form an American Football Defensive Line, Ings for real support and load-sharing with Campbell, and the data suggests that our play this far has actually deserved better outcomes.
I posted my pre-season forecast of a 3rd place finish a couple of weeks, ago and I am still quietly confident that we can achieve that.
UTB & Slava Ukraini!
