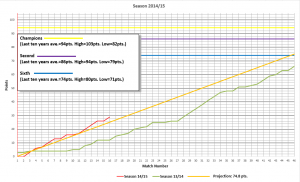
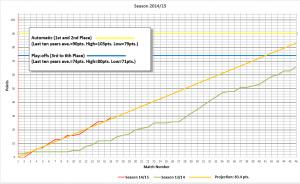
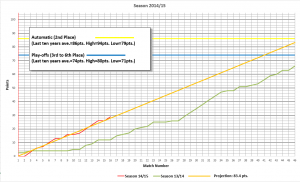
Compared with last season...

All advertisments are hidden for logged in members, why not log in/register?

It's coming. By sheer force of the number of chances we create in most games, we'll rattle up a big score soon.

Maybe...

Interestingly, Clough's Derby battered Millwall 5-1 in the league at The Den on the 14th September 2013.

He was sacked 14 days later. It's a funny old game.
 

I like these trends, the only caveat being that of course that currently there are 4(?) teams ahead of us at the moment who have better/same point projections!

Would that be statistically possible if we still have two of them to play again and two of them to play twice?
 
Apologies, didn't realise the charts from Grafik were taking head to heads into account. Just figured they were using basic points per game analysis. Oops.
 
Apologies, didn't realise the charts from Grafik were taking head to heads into account. Just figured they were using basic points per game analysis. Oops.

Hi Jason. The charts are based on basic (cheeky sod!) points-per-game. Can't see the point of comparing head-to-heads. (SellyOak or Ollesandro are your men for those). Teams go up and get relegated. Improve or deteriorate. For example, Crewe drubbed us last season and yesterday we won. Is that necessarily a sign of 'progress' on our part or that Crewe are shite this season? Ditto Notts County. Whipping boys last year but a more-than tidy outfit htis season.
 
point spreads do vary though due to the ammount of drawn games which lose a point available , ie ten 1-1 draws only give 20 points spread around whereas 10 1-0 s give 30 points to final talliers so points can vary quite a bit
 
I like these trends, the only caveat being that of course that currently there are 4(?) teams ahead of us at the moment who have better/same point projections!

Not necessarily.

1. Bristol City - played 15, 33 points. Therefore a projection of 101.2 pts*
2. Preston - played 13, 28 points. Projection 99.07 pts.
3. Notts County - played 14, 26 points. Projection 85.42 pts.
4. Peterborough - played 15, 26 points. Projection 79.73 pts.
5. Blades - played 14, 26 points. Projection 85.42 pts.

* Projection is points divided by games played x 46.

The position of teams can go down as well as up. Depends if we get a fucking striker...

I apologise GH, I meant 3....
 
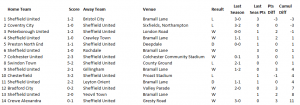
In advance of Saturday's game against Barnsley, here's an update on the SellyOakBlade / Ollessendro comparison to last season:

Winning the last three games has really helped: last season we lost away at Crewe (0-3) and Bradford (0-2) and got, on average, 1.3pts at home against the promoted sides (W v Rotherham, D v Brentford, L v Wolves) which forms the comparison for the Yeovil game.

Comparatively, the only game which we've done worse this season than last is the Bristol City game*. Since then, we've matched or bettered every result against a side we played last year. Keep that up and this will be a very successful season.Untitled.png

*NB we lost 0.5 points by losing at Chesterfield as we got 0.5 points on average from games away at relegated sides last season (Tranmere 0-0, Stevenage 0-0, Shrewsbury 0-2, Carlisle 0-1) but as we beat all four of those sides at home, beating Rochdale maintained the status quo.
 
Not necessarily.

1. Bristol City - played 15, 33 points. Therefore a projection of 101.2 pts*
2. Preston - played 13, 28 points. Projection 99.07 pts.
3. Notts County - played 14, 26 points. Projection 85.42 pts.
4. Peterborough - played 15, 26 points. Projection 79.73 pts.
5. Blades - played 14, 26 points. Projection 85.42 pts.

* Projection is points divided by games played x 46.

The position of teams can go down as well as up. Depends if we get a fucking striker...
But as we have only played 6 at home and have 26 points, working on the projection of win at home and draw away our projected total is 92 points. Only saying like, can't be arsed to work out the projection of our rivals.;)
 
But as we have only played 6 at home and have 26 points, working on the projection of win at home and draw away our projected total is 92 points. Only saying like, can't be arsed to work out the projection of our rivals.;)

So you expect 'Fortress Bramall Lane' to come up with the goods? Good luck with that! :eek:
 
Well, the late revivals are good while they last. But they never do. Also it's time that NC realised that just having Baxter as a lone 'striker' - at home - is an insane experiment that needs binning.

15lose.gif
 
Unfortunate that Higdson was injured today . However he would most likely have been on the bench . I do understand why he uses McNulty as a impact player . Thought the performance was good and the league is still wide open , with the majority of results going our way . Back four looked good and settled , but Baxter is not a out and out striker as we all know . Porter on the bench and not starting shows , we do need ( as said many times) a out and out goal poacher striker to put way , the chances we create. Good strikers are like rocking horse shit and cost money even on loan , if you can find one . Mr Clough will have to resolve this issue or we will be a like for like team in this apparent inconsistent league . 24,000 attendance excellent . We know the cause and the effect , we know the risk , and to mitigate the risk , please Mr McCabe , assist Mr Clough to resolve the issue.

UTB and still bipolar , but know the problem without having to take medication.
 
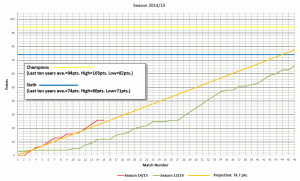
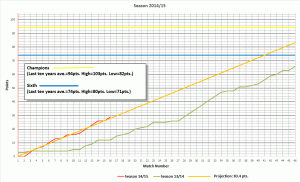
OK, let's drill down into these stats. Today, we passed the one-third point in the season. Game 16 and we've got 29 pts. Last season, it took until Game 28 to reach 29 points. In the near future is where the comparison gets interesting. (No, really! :D). Last season at Game 27, we went on a 7-game winning run (and only lost 3 after that), so we need points in the bank by Game 27 this season to see how the season is shaping up.

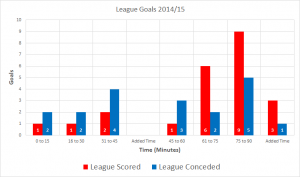
The League Goals chart is also interesting. (No, really! :D). Up to the hour mark, we are comprehensively out-scored by 11 goals to 5. However, after the hour mark we 'come alive' and have scored 18 against 8 conceded.

In conclusion, a) we need to be fired up from the first whistle, as we don't always want to be playing catch-up b) We need a striker and c) There's nowt on telly tonight.
 

What is the average number of points of 2nd?

Last ten years average of 2nd place = 86.3 pts. (High: 94 pts. Low: 79 pts.)

How many do we need for automatic?

mystic-meg-horoscop_384331a.jpg
:D
 
I love these stats. Keep it up grafikhaus. Instead of a champions line plus a second place line maybe we could simply have an automatic promotion line (which would be the 2nd place line renamed). It's probably a more realistic target.....
 
grafikhaus thanks for doing this. Good to see it compared to last season. However I don't get the points projection?

We have 29 points from 16 games, thats just over 1.8 ppg. So that gives a projection of about 83 points?
 
I love these stats. Keep it up grafikhaus. Instead of a champions line plus a second place line maybe we could simply have an automatic promotion line (which would be the 2nd place line renamed). It's probably a more realistic target.....

Good point. Once it gets too complex, it loses all it's sex appeal :)

grafikhaus thanks for doing this. Good to see it compared to last season. However I don't get the points projection?

We have 29 points from 16 games, thats just over 1.8 ppg. So that gives a projection of about 83 points?

Well spotted! I've been frantically buggering about trying to please everybody (while keeping an eye on the clock for opening time...) so I didn't alter the projection after yesterday's game. This, I believe, is a realistic graph:

upload_2014-11-16_9-53-35.png


gym18.gif
 
Now, a point of pedantry (because I know you don't want a lie in this sunday morning), surely the auto line should be at 86, not an average of 1st and 2nd. Or am I being thick?
 
Now, a point of pedantry (because I know you don't want a lie in this sunday morning), surely the auto line should be at 86, not an average of 1st and 2nd. Or am I being thick?

What would be really good would be six automatic lines, for high, average and low 1st place and high, average and low 2nd place.

Actually, if there enough Pantone colours, it would be good to have the same for places 3 to 6, so 18 lines total should do it :-)
 
The graphs keep my feet on the ground, and all this with no prolific strikers on the pitch..

So long as were around the top 6 we can do it this season, I believe that, we know we need auto, we are jinxed in the playoffs, but I think that's where we are heading unless we spend in jan, as I hope and pray for... utb.

Might go back to see how we looked graph wise when nigel got us on that run last year,.if we replicated that,.it would be game over..
 

All advertisments are hidden for logged in members, why not log in/register?

All advertisments are hidden for logged in members, why not log in/register?

Back
Top Bottom