Run in for top 7

All advertisments are hidden for logged in members, why not log in/register?

Har Sole

New Member
Joined
Dec 11, 2018
Messages
33
Reaction score
115
Location
Intake
I've had a look at the run ins for those at the top. These numbers are the average league positions of the remaining opposition (based on yesterday's table). A big number means the opposition (on average) is a bit lower down the league. So big number- easier run in (perhaps). It looks like a good run in for Norwich. Bristol city are on a storming run, but they have some tough games ahead.
This ignores any home/away advantage.

Average League position of opposition for run in

Norwich City 15.4 Easiest run in
Derby County 13.9
Leeds United 13.8
Sheffield United 13.1
Middlesbrough 13.1
West Bromwich Albion 12.9
Bristol City 11.8 Hardest run in


I've had a look at the run ins for those at the top. These numbers are the average league positions of the remaining opposition (based on yesterday's table). A big number means the opposition (on average) is a bit lower down the league. So big number- easier run in (perhaps). It looks like a good run in for Norwich. Bristol city are on a storming run, but they have some tough games ahead.
This ignores any home/away advantage.

Average League position of opposition for run in

Norwich City 15.4 Easiest run in
Derby County 13.9
Leeds United 13.8
Sheffield United 13.1
Middlesbrough 13.1
West Bromwich Albion 12.9
Bristol City 11.8 Hardest run in

Understand your logic with that, but it doesn't quite work like that all of the time.

Take next week it's Norwich v Ipswich - top v bottom and should be a home banker, but doubt Ipswich will see it like that - strange things happen with certain games.

come on Ipswich :)

UTB
 
I've had a look at the run ins for those at the top. These numbers are the average league positions of the remaining opposition (based on yesterday's table). A big number means the opposition (on average) is a bit lower down the league. So big number- easier run in (perhaps). It looks like a good run in for Norwich. Bristol city are on a storming run, but they have some tough games ahead.
This ignores any home/away advantage.

Average League position of opposition for run in

Norwich City 15.4 Easiest run in
Derby County 13.9
Leeds United 13.8
Sheffield United 13.1
Middlesbrough 13.1
West Bromwich Albion 12.9
Bristol City 11.8 Hardest run in
You’ll only know that they are hard or easy run ins when you see the league table after 46 games....
 
Have you factored in in the relegation threatened teams fight for survival, or the mid table teams season having all but finished, and the teams going for promotion coming under pressure?
Has he factored in the shit in the sink, the cats counted in the attendance or how many tins of dolphin, Steve Bruce was given when he arrived at the sty!??
 
And most important has this factored in how many woods a woodchuck chucks if a woodchuck could chuck wood?
 
I've had a look at the run ins for those at the top. These numbers are the average league positions of the remaining opposition (based on yesterday's table). A big number means the opposition (on average) is a bit lower down the league. So big number- easier run in (perhaps). It looks like a good run in for Norwich. Bristol city are on a storming run, but they have some tough games ahead.
This ignores any home/away advantage.

Average League position of opposition for run in

Norwich City 15.4 Easiest run in
Derby County 13.9
Leeds United 13.8
Sheffield United 13.1
Middlesbrough 13.1
West Bromwich Albion 12.9
Bristol City 11.8 Hardest run in

Mate, not wishing to take anything away from your efforts here - it makes interesting reading, but it's almost meaningless I'm afraid, because the league position is not an accurate predictor of how tough each individual game is going to be. I'd put more store on "goal difference" as a predictor of who the teams are most likely to finish in the top 6. Outside the top 6 currently there are a few teams with goal difference similar or not far off some of those in the top 6. Such as Birmingham, Villa, Forest and Hull. These are teams you can expect to be pushing to get into the top 6 if current form continues.
 
Mate, not wishing to take anything away from your efforts here - it makes interesting reading, but it's almost meaningless I'm afraid, because the league position is not an accurate predictor of how tough each individual game is going to be. I'd put more store on "goal difference" as a predictor of who the teams are most likely to finish in the top 6. Outside the top 6 currently there are a few teams with goal difference similar or not far off some of those in the top 6. Such as Birmingham, Villa, Forest and Hull. These are teams you can expect to be pushing to get into the top 6 if current form continues.

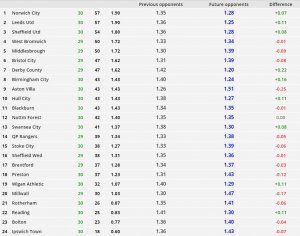
Stumbled upon this yesterday, based on teams current points per game rather than league position, shows Derby to have the easiest run in, with not much in it between the top 3.

Untitled.jpg
 
I went on the 'Footstat' predictor to see what the end of the season would look like; they work out the tables based on giving each team an 'attack rating' and a 'defence rating' (it's not as simple as GF v GD) and then supposedly work out the league from that. I can't help thinking that in some way there is a bias toward the big name teams.
So before the weekends games are included the actual table and prediction look like:

1 Leeds ====================== WBA
2 Norwich ==================== Leeds
3 Blades ===================== Blades
4 WBA ====================== Middlesbro
5 Middlesbro ================== Norwich
6 Derby ====================== Derby
7 Bristol City (in great form) ======= Bristol City
13 Hull (in great form) =========== 12 Hull

Personally I don't see Derby being anywhere near the 6 at the end of the season.
Derby and Norwich have the easiest run ins (Derby are consistently slipping up) but ours is the hardest run in if you throw in the derby in where they have nothing to play for. Having said ours is a hard run in, it also leaves our position directly in our own hands given we can take points from all around us (bar Norwich, who theoretically should go on to be champions.)
So removing my Blade coloured spectacles, I'll go for:
Norwich
WBA
Leeds
Blades
Boro
Bristol C
Hull
 
Where does all this easy game bollocks come from?

According to this logic Pigs, Toy Town And Ipswich were ‘easy’ games. We took 3 points from all
3 and won none.

Just take one game at a time.

All the rest is ‘noise and nonsense’
 
lucky man city had an easy game at newcastle to go closer to the top
then liverpool had a gimme at home to leicester to pull clear


we just have to be good in 14 of the last 16 and hope deflections and bad decisions dont crush us

we can score goals, and keep clean sheets so we give ourselves a good platform
 
Last edited:


I hope in your calculations that you've put the pigs in their rightful place of top 6.
Thought that was because man city etc want them in the premier League the league has to promote by default because they are massive :p:p
 
I used to do little charts like that... until I realised that Shakespeare had summed it up long ago:

"It is a tale told by an idiot, full of sound and fury signifying nothing." (Macbeth)
 
and for those who don't like participating in discussions like this, the option 'not to', is always available.
Of course I'm sure you get much more fun out of the option 'trying to spoil it for those who do like to speculate' but some people are like that.
 
One match at a time, concentrate on our own results, keep moving forwards, that's all we can control.

And can anyone thinking of ringing FH up, stop any talk of Premiership, automatic promotion, Wembley, "if we get to the final we could finally break our Hoodoo" etc etc. It's the start of February, listen to what the Manager says and don't get ahead of yourselves, you're sounding like the scrubbers across the City.
 
If we beat Villa on Friday we go top of the table overnight.

Leeds travel to Boro who don't concede many at home (9 all season) and Norwich have Ipswich. Unfortunately I don't think Ipswich will offer much in the 'derby' this season.
 
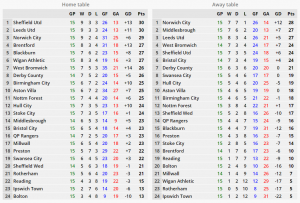
Looking at the "HOME" table - we have the best home record. What I did notice though is of the best 6 home records:

  1. Us
  2. Leeds
  3. Norwich
  4. Brentford
  5. Blackburn
  6. Wigan
We've won at 3, drawn at the other and not played Leeds yet. Very good going!

upload_2019-2-4_14-38-15.png
 
Looking at the "HOME" table - we have the best home record. What I did notice though is of the best 6 home records:

  1. Us
  2. Leeds
  3. Norwich
  4. Brentford
  5. Blackburn
  6. Wigan
We've won at 3, drawn at the other and not played Leeds yet. Very good going!

View attachment 49213

Looking at that it doesn't look like Norwich have lost away since we beat them at The Lane.

Pretty impressive going considering how early in the season it was.
 
I've had a look at the run ins for those at the top. These numbers are the average league positions of the remaining opposition (based on yesterday's table). A big number means the opposition (on average) is a bit lower down the league. So big number- easier run in (perhaps). It looks like a good run in for Norwich. Bristol city are on a storming run, but they have some tough games ahead.
This ignores any home/away advantage.

Average League position of opposition for run in

Norwich City 15.4 Easiest run in
Derby County 13.9
Leeds United 13.8
Sheffield United 13.1
Middlesbrough 13.1
West Bromwich Albion 12.9
Bristol City 11.8 Hardest run in
That’s took some doing,
Are we going to get an expectation V results chart near the end of the season or on a weekly basis?
If they finish in the above order I’ll be coming to with a betting slip mate.
 

All advertisments are hidden for logged in members, why not log in/register?

All advertisments are hidden for logged in members, why not log in/register?

Back
Top Bottom