Post Cardiff v Burnley -11 to Go – Graphs, Charts, Season Forecasts and Blades v Preston X-Stats

All advertisments are hidden for logged in members, why not log in/register?

ucandomagic

Well-Known Member
Joined
Dec 16, 2013
Messages
2,514
Reaction score
10,529
Location
Studley
The reality is that Leeds are likely to get over 100 points and Sunlan are likely to get 90 or just under and so, in all probability, the success of our season now hinges on how we and Burnley perform.

Chart 1
shows the tables and results for all 4 teams after 35 games but our focus is on Burnley, and we are just 2 points ahead of them with 11 games to go. In order to think about how the season might end, we need to look in detail at how those 11 games might turn out for both teams.

Chart 1:
4 Club Tables Matchday 35.webp


Graph 1
shows the positions of all the Top 4 after Matchday 35 and illustrates the point that Sunlan are drifting – Leeds may be catchable, with a lot of favourable winds, but that would only be a small cherry on the very large cake of promotion.

Graph 1:
4 Club Graph Matchday 35.webp


Chart 2
shows the games that we and Burnley have to come – along with a prediction of the points that I think each team might get in each of those 22 matches. I have tried to be realistic, rather than optimistic.

Chart 2:
Blades Burnley Fixtures Matchday 35.webp

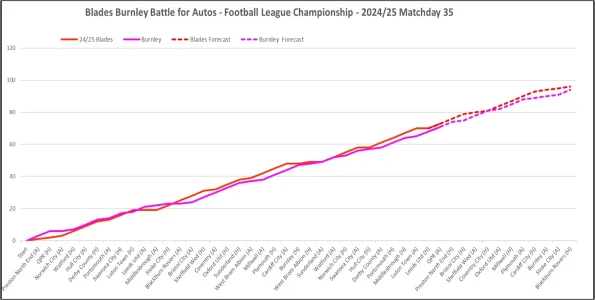
Graph 2
illustrates the results of all of the Blades and Burnley results so far, and includes forecast lines based on my forecasts from Chart 2. Basically, in this scenario we end where we are now, with a 2-point margin, but it actually has us on equal points after our Coventry game. With an end-of-season forecast of Blades 96, Burnley 94 which includes a draw at Turf Moor, it only takes a Burnley win in that game to make the forecast Blades 95, Burnley 96! It's incredible how close we have been for the whole season.

Graph 2:
Blades Burley Graph Matchday 35.webp


So basically, at the moment, it is far too close to call. Also, in our last game, if Blackburn are (i) already secure in the playoffs – or (ii) if they only need a point – or (iii) if they desperately need a win - will make for an entirely different afternoon. Millwall are likely to be “already on the beach” at Burnley.

It’s all pretty tense – but it sure as hell beats the end of last season!

In terms of XG stuff our QPR game XG was

QPR 1.3 – Blades 0.6

Which shows the value of scoring low XG goals, like Ty’s screamer. We don’t create many high XG chances for poachers like Cannon to tap in, so we need to take more low XG shooting opportunities, like for Ty’s goal.

Our next game is on Saturday against Preston at Bramall Lane.

Preston have scored 17 goals in their 17 away games with an XG of 17.2 and conceded 27 with an XGA of 24.3. Blades have scored 25 in 17 home games with an XG of 25.3 and conceded 13 with an XGA of 16.

So the stats would probably suggest 2-1 Blades or 1-1, with 1-0 Blades being the next most likely result.


The Bluebirds failed to fly over the rainbow for us tonight – so let’s hope the Lillywhites wave the white flag at Bramall Lane and the Hatters go mad in Burnley on Saturday!

UTB & Slava Ukraini!
 
Last edited:

Has the comparison against previous promotion seasons been knocked on the head now? I always liked that one
 
We’re totally losing to Burnley, but I can also see us picking up points away at Stoke.. still think we’ll end up 3rd based on the -2 we had to start with which will be absolutely devastating…
 
The reality is that Leeds are likely to get over 100 points and Sunlan are likely to get 90 or just under and so, in all probability, the success of our season now hinges on how we and Burnley perform.

Chart 1
shows the tables and results for all 4 teams after 35 games but our focus is on Burnley, and we are just 2 points ahead of them with 11 games to go. In order to think about how the season might end, we need to look in detail at how those 11 games might turn out for both teams.

Chart 1:
View attachment 205482


Graph 1
shows the positions of all the Top 4 after Matchday 35 and illustrates the point that Sunlan are drifting – Leeds may be catchable, with a lot of favourable winds, but that would only be a small cherry on the very large cake of promotion.

Graph 1:
View attachment 205483


Chart 2
shows the games that we and Burnley have to come – along with a prediction of the points that I think each team might get in each of those 22 matches. I have tried to be realistic, rather than optimistic.

Chart 2:
View attachment 205484

Graph 2
illustrates the results of all of the Blades and Burnley results so far, and includes forecast lines based on my forecasts from Chart 2. Basically, in this scenario we end where we are now, with a 2-point margin, but it actually has us on equal points after our Coventry game. With an end-of-season forecast of Blades 96, Burnley 94 which includes a draw at Turf Moor, it only takes a Burnley win in that game to make the forecast Blades 95, Burnley 96! It's incredible how close we have been for the whole season.

Graph 2:
View attachment 205485


So basically, at the moment, it is far too close to call. Also, in our last game, if Blackburn are (i) already secure in the playoffs – or (ii) if they only need a point – or (iii) if they desperately need a win - will make for an entirely different afternoon. Millwall are likely to be “already on the beach” at Burnley.

It’s all pretty tense – but it sure as hell beats the end of last season!

In terms of XG stuff our QPR game XG was

QPR 1.3 – Blades 0.6

Which shows the value of scoring low XG goals, like Ty’s screamer. We don’t create many high XG chances for poachers like Cannon to tap in, so we need to take more low XG shooting opportunities, like for Ty’s goal.

Our next game is on Saturday against Preston at Bramall Lane.

Preston have scored 17 goals in their 17 away games with an XG of 17.2 and conceded 27 with an XGA of 24.3. Blades have scored 25 in 17 home games with an XG of 25.3 and conceded 13 with an XGA of 16.

So the stats would probably suggest 2-1 Blades or 1-1, with 1-0 Blades being the next most likely result.


The Bluebirds failed to fly over the rainbow for us tonight – so let’s hope the Lillywhites wave the white flag at Bramall Lane and the Hatters go mad in Burnley on Saturday!

UTB & Slava Ukraini!
Interesting stuff.

How the hell did you post that so quickly after the game. I've only just had time for a piss!!

UTB & FTP!
 
We’re totally losing to Burnley, but I can also see us picking up points away at Stoke.. still think we’ll end up 3rd based on the -2 we had to start with which will be absolutely devastating…
Yep - that would be sooooo ‘Sheffield United’…..to add to the ‘Tevez saga’ and the ‘Ched Evan’s saga’….
 
Unfortunately there are always a few strange results… did anyone predict United 0 Hull 3? Let’s hope that if there is to be a strange result it affects Burnley and not us!
 
They are up our ass, I can't see them falling away. The Burnley away game will define auto promotion or play offs.

Reminds of the plastic pitch situation at Oldham, they had a massive unbeaten run until Bassett's boys rocked up, played without fear and took a comfortable 0-2 on that plastic abomination. I hope one of his disciples, Wilder will follow suit at Turf Moor.
Just be brave and go for it is the best tactic.
 
Coventry are on a roll. It's important that we beat them at the Lane as I believe there's an opportunity of them taking points from Burnley at their place in the next round of matches.

A few weeks ago Benjamin Bloom said that sooner or later Burnley's 'clean sheet' run would come to an end. Let's hope after Preston (in the cup) and Cardiff last night they'll start conceding more and dropping points.
 
I think they'll be a few twists before the season ends. I can't see either us or Burnley going through to end of season without losing at least one game.

You only have to look back to end of 2018/19 season with us losing at home to Bristol city and Leeds losing at home to 10 man Wigan.

Need to keep calm.
 
Have a look at Leeds’ remaining fixtures - 8 bottom half teams and none in the Top 6.

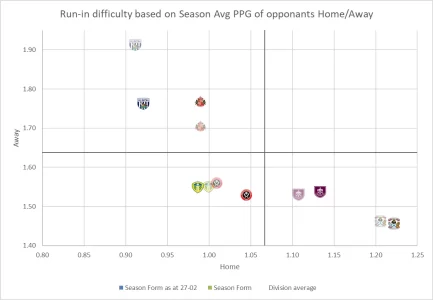
As the league table changes after each game it’s a pretty meaningless stat. Points per game of opponents gives a better indication of the difficulty of remaining fixtures.
 
1741181675551.webp


A table on the respective run-ins of each of the automatic contenders.
Tracks the difficulty of their opponents based on their home / away form. You'll note Wednesday have relegation-like home form (22nd), whilst we have the best away form. We all know form goes out of the window on derby days, but worth a mention,
 

As the league table changes after each game it’s a pretty meaningless stat. Points per game of opponents gives a better indication of the difficulty of remaining fixtures.
As long as there are no games in hand, which there aren’t, the current league table is an exact replica of ppg ranking and adds the additional weighting of goal difference when ppg are the same. So 8 teams in the bottom half of the table are exactly the same as 8 teams in the bottom 12 ppg.

The only way ppg could give a different ranking is if you used home & away ppg, which you might be implying.

If you wanted to be more accurate you would also use just recent form - home or away - rather than full season and include the strength of their recent opponents.

My point wasn’t meant to be a detailed analysis - just to point out that Leeds run-in opponents are lower-placed than ours, so there is some reason to expect that we will struggle to out-perform Leeds on the run in.

Just seen Captain M has done a good analysis above.

UTB & FTP!
 
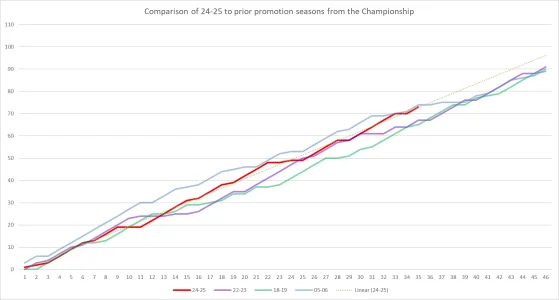
Has the comparison against previous promotion seasons been knocked on the head now? I always liked that one

That was my favourite graph too. It's COMPLETELY UNACCEPTABLE that it's been removed.
It isn`t ucandomagic version, but here is one that I have to hand...

we have an opportunity to surpass our best points total in the championship this century after 36 games on Saturday. At no point this year, in 22-23 or 18-19 have we managed to "get ahead" of the 05-06 promotion season record prior to game 39.
1741186788619.webp
 
The only way ppg could give a different ranking is if you used home & away ppg, which you might be implying.
Ahem... (not based on recent form - I have a version that is just based on the last 8 games but doesn`t account for the H/A of it all)
1741186988076.webp
 
In terms of XG stuff our QPR game XG was

QPR 1.3 – Blades 0.6

Which shows the value of scoring low XG goals, like Ty’s screamer. We don’t create many high XG chances for poachers like Cannon to tap in, so we need to take more low XG shooting opportunities, like for Ty’s goal.
Picking up on this to highlight a fallacy of xG modelling. Firstly, I use Opta which has the score at 1.4-0.9. However, this includes the ludicrous over-punishment of a careless handball right in the corner of the penalty area with a penalty to the hosts; excluding that it's 0.6-0.9. It now looks fairly even until you take into account the fact that QPR needed 16 shots to get to that 0.6: that's 0.02 xG per shot.

It's long been the case that Wilder likes his teams to create fewer, higher quality chances. This is true against QPR where we had 4 of the top 5 chances when ranked by xG (Brereton Díaz's goal (0.30) and late miss (0.24), then QPR's Morgan in first half stoppage time (0.17), Souza's header in the 45th minute (0.12) and O'Hare's follow-up to that (0.10))

The other thing we did well at QPR is score early in each half then sit in and effectively ask QPR to force the issue knowing that it was more than likely that they'd not be able to. We were good value for a 2-0 win until the intervention of the ridiculous handball rules.
Great analysis - lovely stuff
 
Picking up on this to highlight a fallacy of xG modelling. Firstly, I use Opta which has the score at 1.4-0.9. However, this includes the ludicrous over-punishment of a careless handball right in the corner of the penalty area with a penalty to the hosts; excluding that it's 0.6-0.9. It now looks fairly even until you take into account the fact that QPR needed 16 shots to get to that 0.6: that's 0.02 xG per shot.

It's long been the case that Wilder likes his teams to create fewer, higher quality chances. This is true against QPR where we had 4 of the top 5 chances when ranked by xG (Brereton Díaz's goal (0.30) and late miss (0.24), then QPR's Morgan in first half stoppage time (0.17), Souza's header in the 45th minute (0.12) and O'Hare's follow-up to that (0.10))

The other thing we did well at QPR is score early in each half then sit in and effectively ask QPR to force the issue knowing that it was more than likely that they'd not be able to. We were good value for a 2-0 win until the intervention of the ridiculous handball rules.
And I am guessing the xg for the 2nd was pretty low and yet...

I like xg but don't pretend it's perfection but it's more useful than the basic shots on/off target stats
 
And I am guessing the xg for the 2nd was pretty low and yet...

I like xg but don't pretend it's perfection but it's more useful than the basic shots on/off target stats
0.05 but rose to 0.32 post shot which tells you how good a strike it was.
 
0.05 but rose to 0.32 post shot which tells you how good a strike it was.
Explain for the layman please. Does that mean, for the shot taken, including its trajectory, that a goalkeeper would save that roughly 68% of the time?
 
Explain for the layman please. Does that mean, for the shot taken, including its trajectory, that a goalkeeper would save that roughly 68% of the time?
Yes. Shooting in the situation Campbell did can reasonably be expected to result in a goal 1 in 20 times but Campbell's shot was sufficiently good to increase that to 1 in 3. The keeper had clear line of sight but I think was distracted by O'Hare's movement and took a step to his right (Campbell's left), opening the near top corner up for the shot, meaning Campbell's shot was the 1 rather than the 2 which are saved.
 
Yes. Shooting in the situation Campbell did can reasonably be expected to result in a goal 1 in 20 times but Campbell's shot was sufficiently good to increase that to 1 in 3. The keeper had clear line of sight but I think was distracted by O'Hare's movement and took a step to his right (Campbell's left), opening the near top corner up for the shot, meaning Campbell's shot was the 1 rather than the 2 which are saved.
Thanks - it certainly didn`t look like a shot that would be saved 68% of the time - but as you say maybe the step to the right impacted it.
 
Have a look at Leeds’ remaining fixtures - 8 bottom half teams and none in the Top 6.
My recollection of previous seasons is that towards the end you tend to get some unexpected results where teams at or near the bottom fighting to stay up surprise the teams at the top. Let's hope that happens to Burnly and not us.
 

All advertisments are hidden for logged in members, why not log in/register?

All advertisments are hidden for logged in members, why not log in/register?

Back
Top Bottom