ucandomagic
Well-Known Member
Enough of speculation about takeovers (holidays!), kit & transfer rumours, we have our fixture list, and I can start plotting!
Firstly, what do we need to do to survive?
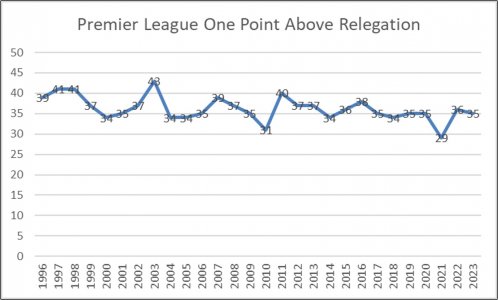
Graph 1 shows what 1 point above the relegated teams has been for all of the 28 Prem seasons of 20 teams. You can see that 40 points was enough to survive for all but 3 of those 28 seasons. However, 38 has been more than enough for the last 12 seasons – so I’ll use 38 – a point a game as a realistic survival target.
Graph 1:

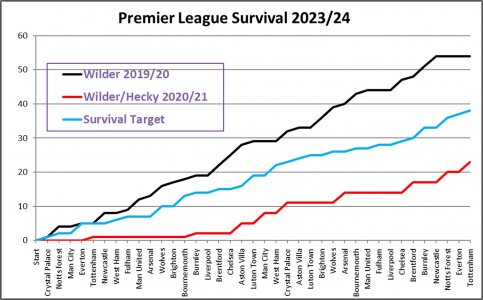
Graph 2 will be a plot that compares our progress against our last 2 Prem seasons and against my set of benchmark results which would achieve 38 points, and probable survival.
My benchmark takes account of who our opponents are each week – the 19/20 and 20/21 seasons are just the results from the same week – not the same opponents.
Graph 2:

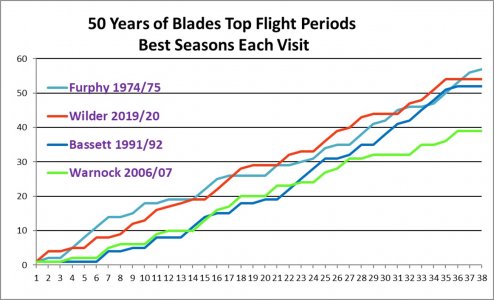
Graph 3 will plot our progress against the best seasons from each of the 4 periods that I have watched the Blades in the top flight. The early seasons have been modified to account for 3 point wins and 20 team leagues. I have used the actual results against the top 19 teams in each of those years.
Graph 3:

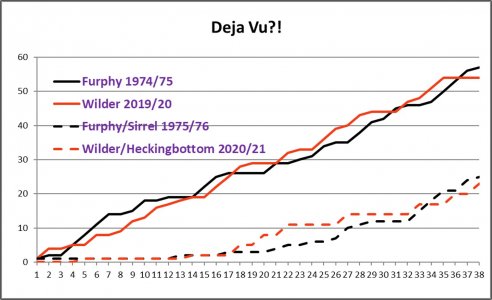
Graph 4 is a salutory reminder of how the worst times can come straight after the best. Our best 2 top flight seasons were in 74/75 and 19/20, but were immediately followed by our worst 2.
I still find it amazing how those 2-year periods were almost identical!
Graph 4:

So Roll on August 12th and Crystal Palace - Let Battle Commence
UTB & Slava Ukraini
Firstly, what do we need to do to survive?
Graph 1 shows what 1 point above the relegated teams has been for all of the 28 Prem seasons of 20 teams. You can see that 40 points was enough to survive for all but 3 of those 28 seasons. However, 38 has been more than enough for the last 12 seasons – so I’ll use 38 – a point a game as a realistic survival target.
Graph 1:

Graph 2 will be a plot that compares our progress against our last 2 Prem seasons and against my set of benchmark results which would achieve 38 points, and probable survival.
My benchmark takes account of who our opponents are each week – the 19/20 and 20/21 seasons are just the results from the same week – not the same opponents.
Graph 2:

Graph 3 will plot our progress against the best seasons from each of the 4 periods that I have watched the Blades in the top flight. The early seasons have been modified to account for 3 point wins and 20 team leagues. I have used the actual results against the top 19 teams in each of those years.
Graph 3:

Graph 4 is a salutory reminder of how the worst times can come straight after the best. Our best 2 top flight seasons were in 74/75 and 19/20, but were immediately followed by our worst 2.
I still find it amazing how those 2-year periods were almost identical!
Graph 4:

So Roll on August 12th and Crystal Palace - Let Battle Commence
UTB & Slava Ukraini


