ucandomagic
Active Member
(Saved this until after the Sunday games so that the Table was up to date.)
I quite enjoyed yesterday, even though it was generally a scrappy game which is likely to be a Championship game next season. A point each was probably a fair reflection. (My cataract-free eye gave me a much clearer view of things!) Oli Mac and Cameron looked great together, Hamer was excellent and Souza was solid. George, Anel and JLT were fine and Thomas immediately looked the real deal - a left-sided George, and way better than Lowe or Larouci. Cameron’s goal was the real highlight, after genuine quality from Hamer and Oli Mac.
Most underwhelming were Traore’s “no-impact substitute” appearance and Norwood’s “pressing-by-pointing” display. I don’t think Hecky should have taken Cameron off, but he always puts a lot of focus on using and developing young players like Traore.
Oli Mac has become a real leader, and I think his friendship with McA will bring out the best in both of them. He deserved a goal at the end - but Pickford atoned for his og with a great double save.
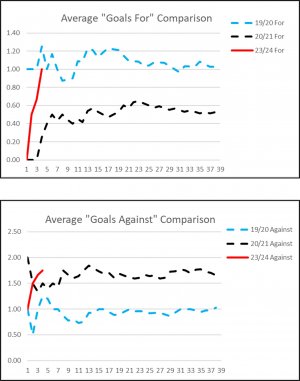
Graph 1 is the extra graph that was requested last week, showing our average goals per game, for and against, compared to our 2 most recent Prem seasons. Interestingly, our “Average Goals For” is very close to the start of our great season in 19/20, but our “Average Goals Against” is still worse than our dreadful start in 20/21.
Graph 1:
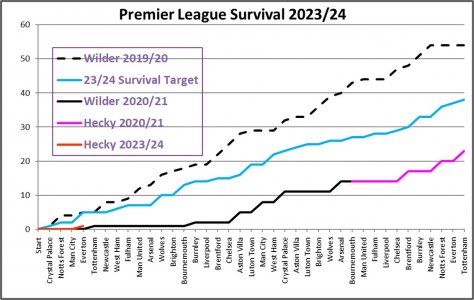
Graph 2 is the plot that compares our progress against our last 2 Prem seasons and against my benchmark results to achieve 38 points, and probable survival. Our red line has left ground zero at last! My benchmark survival line takes account of who our opponents are each week – the 19/20 and 20/21 seasons are just the results from the same game day – not the same opponents.
On Graph 2 you can see that, on 1 point, we are now 4 points behind my 38 point survival benchmark results. However, my benchmark results have us needing a total of 7 points after 10 games – so a point a game over the next 6 would get us back on track.
Graph 2:
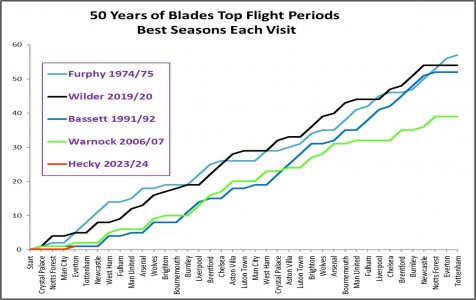
Graph 3 plots our progress against the best seasons from each of the previous 4 periods that I have watched the Blades in the top flight. The early seasons have been modified to account for 3 point wins and 20 teams. I have used the actual results against the top 19 teams in each of those years. You can see that we’re still level with Bassett’s best season in 91/92 and just a point behind Warnock in 06/07.
Graph 3:
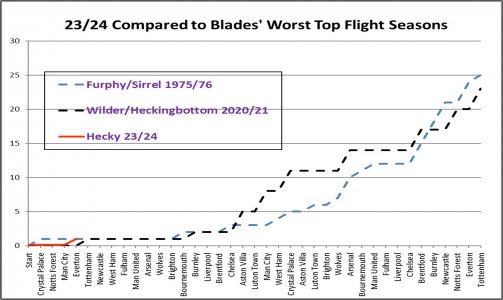
For the pessimists, Graph 4 plots our progress against the worst 2 Top Tier seasons that I have experienced - 75/76 under Furphy/Sirrel and 20/21 under Wilder and Hecky. Again, for 75/76 I’ve used the results against the top 19 teams that year and converted to 3 points for a win. We’re now ahead of Wilder in 20/21 and level with Furphy in 1975. In those earlier seasons we had the equivalent of 3 points from 20 games in 75/76 and 2 points from 17 games in 20/21 – so by those standards watching this season should be “luxury”!
Graph 4:
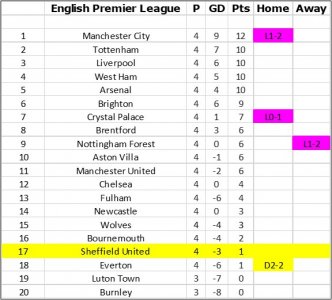
Finally the League Table – which still shows us above the drop zone. Goal difference, and playing more games than Burnley and Luton, is keeping us above 18th – but it’s still nice to see the table with us in a safe position!
Also. we conceded late against Forest and City, and Pickford's last-minute worldy cost us 2 points against Everton. Turn those 3 split seconds round and we have 5 points and zero goal difference and we'd be 10th - above Chelsea (and Forest because they'd be on 4). So, our performances are fine -just fine margins and we'd all be over the moon.
League Table:
A few tough games coming up now in the next 6 – including Spurs, Newcastle, West Ham, Man U, and Arsenal, but I’m optimistically hoping for 6 points from those games plus Fulham, to get back on track with my survival benchmark. After all, we came within a couple of minutes of taking a point off Citeh!
UTB & Slava Ukraini
I quite enjoyed yesterday, even though it was generally a scrappy game which is likely to be a Championship game next season. A point each was probably a fair reflection. (My cataract-free eye gave me a much clearer view of things!) Oli Mac and Cameron looked great together, Hamer was excellent and Souza was solid. George, Anel and JLT were fine and Thomas immediately looked the real deal - a left-sided George, and way better than Lowe or Larouci. Cameron’s goal was the real highlight, after genuine quality from Hamer and Oli Mac.
Most underwhelming were Traore’s “no-impact substitute” appearance and Norwood’s “pressing-by-pointing” display. I don’t think Hecky should have taken Cameron off, but he always puts a lot of focus on using and developing young players like Traore.
Oli Mac has become a real leader, and I think his friendship with McA will bring out the best in both of them. He deserved a goal at the end - but Pickford atoned for his og with a great double save.
Graph 1 is the extra graph that was requested last week, showing our average goals per game, for and against, compared to our 2 most recent Prem seasons. Interestingly, our “Average Goals For” is very close to the start of our great season in 19/20, but our “Average Goals Against” is still worse than our dreadful start in 20/21.
Graph 1:

Graph 2 is the plot that compares our progress against our last 2 Prem seasons and against my benchmark results to achieve 38 points, and probable survival. Our red line has left ground zero at last! My benchmark survival line takes account of who our opponents are each week – the 19/20 and 20/21 seasons are just the results from the same game day – not the same opponents.
On Graph 2 you can see that, on 1 point, we are now 4 points behind my 38 point survival benchmark results. However, my benchmark results have us needing a total of 7 points after 10 games – so a point a game over the next 6 would get us back on track.
Graph 2:

Graph 3 plots our progress against the best seasons from each of the previous 4 periods that I have watched the Blades in the top flight. The early seasons have been modified to account for 3 point wins and 20 teams. I have used the actual results against the top 19 teams in each of those years. You can see that we’re still level with Bassett’s best season in 91/92 and just a point behind Warnock in 06/07.
Graph 3:

For the pessimists, Graph 4 plots our progress against the worst 2 Top Tier seasons that I have experienced - 75/76 under Furphy/Sirrel and 20/21 under Wilder and Hecky. Again, for 75/76 I’ve used the results against the top 19 teams that year and converted to 3 points for a win. We’re now ahead of Wilder in 20/21 and level with Furphy in 1975. In those earlier seasons we had the equivalent of 3 points from 20 games in 75/76 and 2 points from 17 games in 20/21 – so by those standards watching this season should be “luxury”!
Graph 4:

Finally the League Table – which still shows us above the drop zone. Goal difference, and playing more games than Burnley and Luton, is keeping us above 18th – but it’s still nice to see the table with us in a safe position!
Also. we conceded late against Forest and City, and Pickford's last-minute worldy cost us 2 points against Everton. Turn those 3 split seconds round and we have 5 points and zero goal difference and we'd be 10th - above Chelsea (and Forest because they'd be on 4). So, our performances are fine -just fine margins and we'd all be over the moon.
League Table:

A few tough games coming up now in the next 6 – including Spurs, Newcastle, West Ham, Man U, and Arsenal, but I’m optimistically hoping for 6 points from those games plus Fulham, to get back on track with my survival benchmark. After all, we came within a couple of minutes of taking a point off Citeh!
UTB & Slava Ukraini


