ucandomagic
Well-Known Member
As promised, I am posting my usual graphs tonight – I’ll have a look at the Top 4 graph and comparisons tomorrow, after Weeds have played.
I thought that Preston were poor today - and the first 10 minutes suggested that we would score a hatful. Then we went into the frustrating version of Wilderball, - only shoot with an xg of above 0.8 mode (ie never) - and kept losing the ball in trying.
Hamza isn’t a great full back - his passing out is terrible - he seems to pass forwards without considering that the opposition can move before the ball gets to our man! He was miles better in CM in the second half. Campbell & Peck were outstanding throughout. It baffles me why Burrows, somebody with a wand for a left foot, frequently comes inside, rather than getting outside and floating it over. Fortunately, he obliged me on 56 minutes and Tyrese, once again, was there to provide the finish. Here’s hoping Gus and Vini are OK for Tuesday.
So now the graphs and charts that show factually where we are at present.
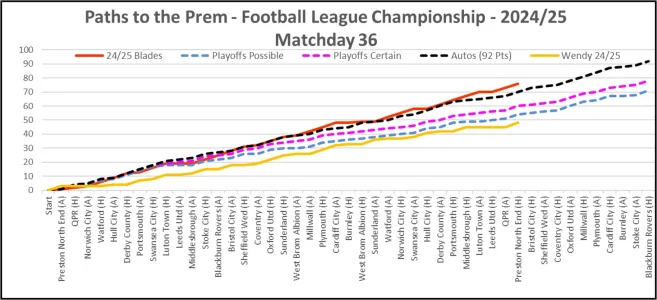
Graph 1 compares our progress against 3 benchmark sets of results which represent Automatic Promotion, Playoff Certainty and Playoff Possibility. My benchmarks take account of who our opponents are each week. On 76 points, comparing to my benchmarks, we are now 6 points ahead of my Autos Promotion (92-point) schedule – and that is with our 2 point deduction. My forecast for us is now 96-98 points and second place – a club 2nd Tier record.
Graph 1:

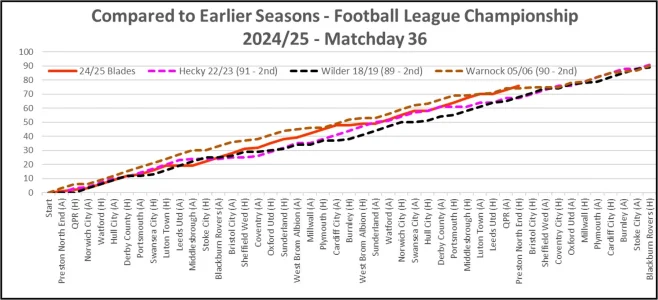
Graph 2 compares this season against our last 3 successful promotions from this level (all in second place), in 2005/06, 2018/19 and 2022/23. On 76 points after 36 games (with the 2-point deduction) we are still 8 points ahead of the 68 points that we had under Wilder in 18/19, now 9 points ahead of Hecky in 22/23. For the first time, though, we are now also a point ahead of Warnock in 05/06.
So we are still a huge 8 points ahead of where we were in that great 18/19 Wilder promotion season, even with a 2-point deduction.
Graph 2:

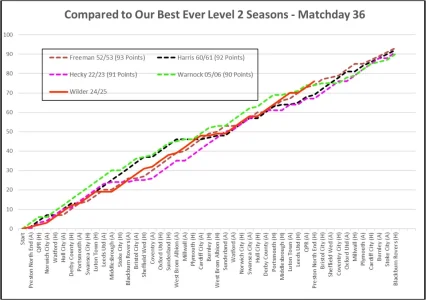
With regard to earlier seasons, Graph3 is the comparison with all of our best historical Level 2 Seasons, for seasons with more than 22 games (which goes back to 1893/94). I don’t think a 22-game or less season is a fair comparison.
Graph 3 shows that to finish on a record high we need to beat Freeman’s 1952-53, results which normalised to 93 points under the current framework. If we get anywhere close to my 96-98 forecast in my opinion we will certainly achieve (even with 2 points deducted!) our best Level 2 performance EVER.
Graph 3:

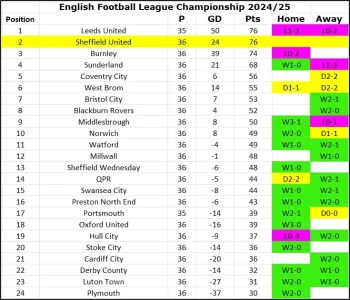
Next, the coloured annotated up-to-date League Table, before the Pompey – Leeds game tomorrow, which highlights where our strengths and weaknesses have been against opponents’ league positions. With Burnley just 2 points behind it looks like it is going to the wire – and that game at Turf more looks ever more important. Their next 2 are Home against West Brom and Away at Swansea – ours Home to Bristol City and Away at Hillsborough. I’d like to see the gap increase by a couple through those games.
League Table:

I’m back staying in the Buddhist Air BnB for the Bristol City game on Tuesday so:-
Om-Mani-Padme-Hum.
UTB & Slava Ukraini!
I thought that Preston were poor today - and the first 10 minutes suggested that we would score a hatful. Then we went into the frustrating version of Wilderball, - only shoot with an xg of above 0.8 mode (ie never) - and kept losing the ball in trying.
Hamza isn’t a great full back - his passing out is terrible - he seems to pass forwards without considering that the opposition can move before the ball gets to our man! He was miles better in CM in the second half. Campbell & Peck were outstanding throughout. It baffles me why Burrows, somebody with a wand for a left foot, frequently comes inside, rather than getting outside and floating it over. Fortunately, he obliged me on 56 minutes and Tyrese, once again, was there to provide the finish. Here’s hoping Gus and Vini are OK for Tuesday.
So now the graphs and charts that show factually where we are at present.
Graph 1 compares our progress against 3 benchmark sets of results which represent Automatic Promotion, Playoff Certainty and Playoff Possibility. My benchmarks take account of who our opponents are each week. On 76 points, comparing to my benchmarks, we are now 6 points ahead of my Autos Promotion (92-point) schedule – and that is with our 2 point deduction. My forecast for us is now 96-98 points and second place – a club 2nd Tier record.
Graph 1:

Graph 2 compares this season against our last 3 successful promotions from this level (all in second place), in 2005/06, 2018/19 and 2022/23. On 76 points after 36 games (with the 2-point deduction) we are still 8 points ahead of the 68 points that we had under Wilder in 18/19, now 9 points ahead of Hecky in 22/23. For the first time, though, we are now also a point ahead of Warnock in 05/06.
So we are still a huge 8 points ahead of where we were in that great 18/19 Wilder promotion season, even with a 2-point deduction.
Graph 2:

With regard to earlier seasons, Graph3 is the comparison with all of our best historical Level 2 Seasons, for seasons with more than 22 games (which goes back to 1893/94). I don’t think a 22-game or less season is a fair comparison.
Graph 3 shows that to finish on a record high we need to beat Freeman’s 1952-53, results which normalised to 93 points under the current framework. If we get anywhere close to my 96-98 forecast in my opinion we will certainly achieve (even with 2 points deducted!) our best Level 2 performance EVER.
Graph 3:

Next, the coloured annotated up-to-date League Table, before the Pompey – Leeds game tomorrow, which highlights where our strengths and weaknesses have been against opponents’ league positions. With Burnley just 2 points behind it looks like it is going to the wire – and that game at Turf more looks ever more important. Their next 2 are Home against West Brom and Away at Swansea – ours Home to Bristol City and Away at Hillsborough. I’d like to see the gap increase by a couple through those games.
League Table:

I’m back staying in the Buddhist Air BnB for the Bristol City game on Tuesday so:-
Om-Mani-Padme-Hum.
UTB & Slava Ukraini!
