Compared to ????

All advertisments are hidden for logged in members, why not log in/register?

PTBlade

Retired
Joined
Jan 30, 2012
Messages
380
Reaction score
812
Compared with last season graphs were fascinating last season but will be pretty pointless now ( unless we do a Liecester)
So what do we want?
Possibly a graph v/s the performance of the bottom 6/8 from last season?
A mini League table for the projected bottom 10/12 clubs might give us an idea how we are doing?
Over to you #grafikhaus ?


Compared with last season graphs were fascinating last season but will be pretty pointless now ( unless we do a Liecester)
So what do we want?
Possibly a graph v/s the performance of the bottom 6/8 from last season?
A mini League table for the projected bottom 10/12 clubs might give us an idea how we are doing?
Over to you #grafikhaus ?

Could compare to our last season in the Premier League.
 
Only complete idiots get excited about a table after one or two games.

Whilst this may be true,

If we'd beaten Bournemouth and beat Palace, I wouldn't be looking at the table and thinking about title races...

however - with 6 points in the bag, I'd certainly be more 'settled' 😂 (with maybe a sniff of excitement about the next game!)
 
Compared with last season graphs were fascinating last season but will be pretty pointless now ( unless we do a Liecester)
So what do we want?
Possibly a graph v/s the performance of the bottom 6/8 from last season?
A mini League table for the projected bottom 10/12 clubs might give us an idea how we are doing?
Over to you #grafikhaus ?
Leicester not Liecester.
 
Go on, then.

1565590527538.png

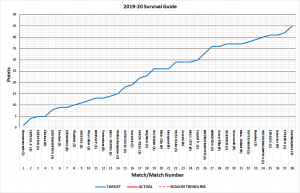
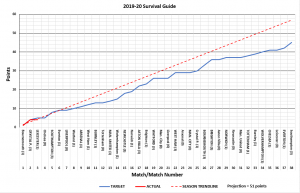
Our point at Bournemouth is 'hiding' behind the (blue) target line - as it will be when we're on four points after the Palace game. I've used the x-axis (horizontal) to try to predict our points against each opponent. The trendline is far too early to show. Unless it's Wednesday.

If all goes to plan, we'll end up on 45 points - more than safe - until next May when Richard Scudamore/Gary 'Paul Hollywood' Lineker orders an investigation into some long-forgotten VAR decision that they want overturning. (Remember, 2020 is 'the rule of thirteen...')
 
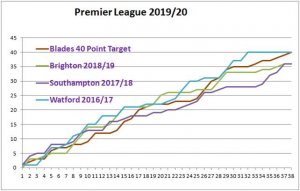
Oh I do like a graph, perhaps a nice line graph of the teams that finished 17 and 18 would be simple and relevant. Then can you add one for the team that finished 12 which is my prediction for us, remember the table was skewed by the top two getting so many points. Thanks.


Compared with last season graphs were fascinating last season but will be pretty pointless now ( unless we do a Liecester)
So what do we want?
Possibly a graph v/s the performance of the bottom 6/8 from last season?
A mini League table for the projected bottom 10/12 clubs might give us an idea how we are doing?
Over to you #grafikhaus ?
How about a graph comparing our performance to that of Bradford Park Avenue in their last season in the football league? That would lift your spirits?
 
How about a graph comparing our performance to that of Bradford Park Avenue in their last season in the football league? That would lift your spirits?

I'll work on it. After I've done one about 'Compared to teams who've worn red and white since 1992', 'a nice line graph of the teams that finished 17 and 18 ', 'our last season in the Premier League', a graph v/s the performance of the bottom 6/8 from last season and a mini League table for the projected bottom 10/12 clubs '. Only joking. Really. 😂
 

Can we start with a graph to make sure we beat Derby's total of 11 points first? Then maybe out the worst 10, then worst 20? Don't want to get too far ahead of ourselves, this is United we're talking about after all!
 
Whilst this may be true,

If we'd beaten Bournemouth and beat Palace, I wouldn't be looking at the table and thinking about title races...

however - with 6 points in the bag, I'd certainly be more 'settled' 😂 (with maybe a sniff of excitement about the next game!)

You'll fit right in with the new crowd at away games :D
 
Pigs graph has been flatlining for years but then had a dip around sept 24 some year....then it became a cabbage graph...then not.....now it's just bullecks....
 
Derby down with 11 points.
Drew their first game.
Hmmmm.

We'll be fine.:oops:
 
Compared with last season graphs were fascinating last season but will be pretty pointless now ( unless we do a Liecester)
So what do we want?
Possibly a graph v/s the performance of the bottom 6/8 from last season?
A mini League table for the projected bottom 10/12 clubs might give us an idea how we are doing?
Over to you #grafikhaus ?

2019 2020 Target.jpg
 
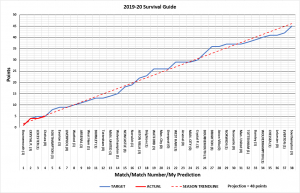
1566145421267.png

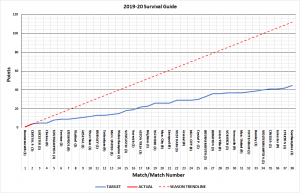
Don't get too enthused about the 'Trendline' as early seasons can produce freak statistics - like Wednesday being briefly on top of the Championship. We're on course for 78 points or - as I prefer to look at it - 'Four down, 34 to go.,'
 

All advertisments are hidden for logged in members, why not log in/register?

All advertisments are hidden for logged in members, why not log in/register?

Back
Top Bottom