Assorted facts and stats from the 2nd tier playoffs

All advertisments are hidden for logged in members, why not log in/register?

Selly

Ask me about Updog...
Joined
Aug 31, 2005
Messages
10,207
Reaction score
8,069
Location
Birmingham
I decided to take a look back at all the 2nd tier playoff campaigns back to 1988/89 and draw out a number of facts - as follows:

1 - No team has finished with a greater points differential against their play of opponents that Sheffield United (24-25) - 22 Points

Top 5 points differentials
  1. Sheffield United vs Coventry - 2025 - 22 points
  2. Leeds United vs Coventry - 2024 - 17 points
  3. Sunderland vs Sheffield United - 1998 - 16 points
  4. Brighton vs Sheffield Wednesday (1990) - 2016 - 15 points
  5. =Bolton vs WBA - 2001
    =Derby vs Brighton - 2014
    =Fulham vs Derby - 2018 - 13 points

2 - No team has ever lost a playoff semi final to an opponent more than 15 points behind

Top 5 losing semi finalist points differentials
  1. Brighton lost to Sheffield Wednesday (1990) - 2016 - 15 points
  2. =Portsmouth lost to Leicester - 1993
    =Ipswich lost to WHU - 2005 - 12 points
  3. Wolves lost to Norwich - 2002 - 11 points
  4. Ipswich lost to Bolton - 1999 - 10 points
3 - No team has failed to make the final having achieved more than 89 points

Top 5 points totals for losing Semi finalists
  1. Brighton lost to Sheffield Wednesday (1990) - 2016 - 89 points
  2. Portsmouth lost to Leicester - 1993 - 88 points
  3. =Ipswich lost to Bolton - 1999 - 86 points
    =Wolves lost to Norwich - 2002 - 86 points
  4. Ipswich lost to WHU - 2005 - 85 points
4 - Having made the final - no team has lost to a team who finished more than 6 point behind them

Top 5 points differentials of losing finalists
  1. Cardiff lost to Blackpool - 2010 - 6 points
  2. =Watford lost to Palace - 2013
    =Derby lost to QPR - 2014 - 5 points
  3. =Palace lost to Leicester - 1996
    =Sheffield United lost to Wolves - 2003
    =Sheffield United lost to Burnley - 2009
    =Reading lost to Huddersfield - 2017 - 4 points
5 - More points = more likely to make the final

This is probably not a massive surprise, but the average points for teams making the final is 78.5, and for teams that don`t make the final is 76.4

6 - Teams finishing 3rd make the final 66.7% of the time
1746519946828.webp


7 - Teams in 3rd get promoted 35% of the time - the team in 6th does not "always win the playoffs"

1746519996095.webp

What does this tell us about this years playoffs?

ABSOLUTELY NOTHING :)
 

I decided to take a look back at all the 2nd tier playoff campaigns back to 1988/89 and draw out a number of facts - as follows:

1 - No team has finished with a greater points differential against their play of opponents that Sheffield United (24-25) - 22 Points

Top 5 points differentials
  1. Sheffield United vs Coventry - 2025 - 22 points
  2. Leeds United vs Coventry - 2024 - 17 points
  3. Sunderland vs Sheffield United - 1998 - 16 points
  4. Brighton vs Sheffield Wednesday (1990) - 2016 - 15 points
  5. =Bolton vs WBA - 2001
    =Derby vs Brighton - 2014
    =Fulham vs Derby - 2018 - 13 points

2 - No team has ever lost a playoff semi final to an opponent more than 15 points behind

Top 5 losing semi finalist points differentials
  1. Brighton lost to Sheffield Wednesday (1990) - 2016 - 15 points
  2. =Portsmouth lost to Leicester - 1993
    =Ipswich lost to WHU - 2005 - 12 points
  3. Wolves lost to Norwich - 2002 - 11 points
  4. Ipswich lost to Bolton - 1999 - 10 points
3 - No team has failed to make the final having achieved more than 89 points

Top 5 points totals for losing Semi finalists
  1. Brighton lost to Sheffield Wednesday (1990) - 2016 - 89 points
  2. Portsmouth lost to Leicester - 1993 - 88 points
  3. =Ipswich lost to Bolton - 1999 - 86 points
    =Wolves lost to Norwich - 2002 - 86 points
  4. Ipswich lost to WHU - 2005 - 85 points
4 - Having made the final - no team has lost to a team who finished more than 6 point behind them

Top 5 points differentials of losing finalists
  1. Cardiff lost to Blackpool - 2010 - 6 points
  2. =Watford lost to Palace - 2013
    =Derby lost to QPR - 2014 - 5 points
  3. =Palace lost to Leicester - 1996
    =Sheffield United lost to Wolves - 2003
    =Sheffield United lost to Burnley - 2009
    =Reading lost to Huddersfield - 2017 - 4 points
5 - More points = more likely to make the final

This is probably not a massive surprise, but the average points for teams making the final is 78.5, and for teams that don`t make the final is 76.4

6 - Teams finishing 3rd make the final 66.7% of the time
View attachment 210118


7 - Teams in 3rd get promoted 35% of the time - the team in 6th does not "always win the playoffs"

View attachment 210119

What does this tell us about this years playoffs?

ABSOLUTELY NOTHING :)
Records are made to be broken, as we found last season
 
Records are made to be broken, as we found last season
Indeed - and one way or another one of the following will be true

1 - We will finally win the PO at the 10th time of asking
2 - we will become the club that lost a semi final to a team the highest number of points behind EVER (Bristol C - 22 points)
3 - we will become the club that lost a final to a team the highest number of points behind EVER (Sunderland - 14 points, Coventry - 21 points)
 
I decided to take a look back at all the 2nd tier playoff campaigns back to 1988/89 and draw out a number of facts - as follows:

1 - No team has finished with a greater points differential against their play of opponents that Sheffield United (24-25) - 22 Points

Top 5 points differentials
  1. Sheffield United vs Coventry - 2025 - 22 points
  2. Leeds United vs Coventry - 2024 - 17 points
  3. Sunderland vs Sheffield United - 1998 - 16 points
  4. Brighton vs Sheffield Wednesday (1990) - 2016 - 15 points
  5. =Bolton vs WBA - 2001
    =Derby vs Brighton - 2014
    =Fulham vs Derby - 2018 - 13 points

2 - No team has ever lost a playoff semi final to an opponent more than 15 points behind

Top 5 losing semi finalist points differentials
  1. Brighton lost to Sheffield Wednesday (1990) - 2016 - 15 points
  2. =Portsmouth lost to Leicester - 1993
    =Ipswich lost to WHU - 2005 - 12 points
  3. Wolves lost to Norwich - 2002 - 11 points
  4. Ipswich lost to Bolton - 1999 - 10 points
3 - No team has failed to make the final having achieved more than 89 points

Top 5 points totals for losing Semi finalists
  1. Brighton lost to Sheffield Wednesday (1990) - 2016 - 89 points
  2. Portsmouth lost to Leicester - 1993 - 88 points
  3. =Ipswich lost to Bolton - 1999 - 86 points
    =Wolves lost to Norwich - 2002 - 86 points
  4. Ipswich lost to WHU - 2005 - 85 points
4 - Having made the final - no team has lost to a team who finished more than 6 point behind them

Top 5 points differentials of losing finalists
  1. Cardiff lost to Blackpool - 2010 - 6 points
  2. =Watford lost to Palace - 2013
    =Derby lost to QPR - 2014 - 5 points
  3. =Palace lost to Leicester - 1996
    =Sheffield United lost to Wolves - 2003
    =Sheffield United lost to Burnley - 2009
    =Reading lost to Huddersfield - 2017 - 4 points
5 - More points = more likely to make the final

This is probably not a massive surprise, but the average points for teams making the final is 78.5, and for teams that don`t make the final is 76.4

6 - Teams finishing 3rd make the final 66.7% of the time
View attachment 210118


7 - Teams in 3rd get promoted 35% of the time - the team in 6th does not "always win the playoffs"

View attachment 210119

What does this tell us about this years playoffs?

ABSOLUTELY NOTHING :)
 

Attachments

  • IMG_8790.webp
    IMG_8790.webp
    16.1 KB · Views: 2
I decided to take a look back at all the 2nd tier playoff campaigns back to 1988/89 and draw out a number of facts - as follows:

1 - No team has finished with a greater points differential against their play of opponents that Sheffield United (24-25) - 22 Points

Top 5 points differentials
  1. Sheffield United vs Coventry - 2025 - 22 points
  2. Leeds United vs Coventry - 2024 - 17 points
  3. Sunderland vs Sheffield United - 1998 - 16 points
  4. Brighton vs Sheffield Wednesday (1990) - 2016 - 15 points
  5. =Bolton vs WBA - 2001
    =Derby vs Brighton - 2014
    =Fulham vs Derby - 2018 - 13 points
7 - Teams in 3rd get promoted 35% of the time - the team in 6th does not "always win the playoffs"

View attachment 210119

So it's 65% that we won't get promoted, that makes me feel much better thanks for that!


😜
 
So it's 65% that we won't get promoted, that makes me feel much better thanks for that!


😜
Yes, when you look at it positionally.

If you look at it in 5 point increments you get this:

1746531011148.webp

So a 57% chance...

I will however note that on the prior 2 occasions when a team achieved 90 points - they did not go up...
 
I decided to take a look back at all the 2nd tier playoff campaigns back to 1988/89 and draw out a number of facts - as follows:

1 - No team has finished with a greater points differential against their play of opponents that Sheffield United (24-25) - 22 Points

Top 5 points differentials
  1. Sheffield United vs Coventry - 2025 - 22 points
  2. Leeds United vs Coventry - 2024 - 17 points
  3. Sunderland vs Sheffield United - 1998 - 16 points
  4. Brighton vs Sheffield Wednesday (1990) - 2016 - 15 points
  5. =Bolton vs WBA - 2001
    =Derby vs Brighton - 2014
    =Fulham vs Derby - 2018 - 13 points

2 - No team has ever lost a playoff semi final to an opponent more than 15 points behind

Top 5 losing semi finalist points differentials
  1. Brighton lost to Sheffield Wednesday (1990) - 2016 - 15 points
  2. =Portsmouth lost to Leicester - 1993
    =Ipswich lost to WHU - 2005 - 12 points
  3. Wolves lost to Norwich - 2002 - 11 points
  4. Ipswich lost to Bolton - 1999 - 10 points
3 - No team has failed to make the final having achieved more than 89 points

Top 5 points totals for losing Semi finalists
  1. Brighton lost to Sheffield Wednesday (1990) - 2016 - 89 points
  2. Portsmouth lost to Leicester - 1993 - 88 points
  3. =Ipswich lost to Bolton - 1999 - 86 points
    =Wolves lost to Norwich - 2002 - 86 points
  4. Ipswich lost to WHU - 2005 - 85 points
4 - Having made the final - no team has lost to a team who finished more than 6 point behind them

Top 5 points differentials of losing finalists
  1. Cardiff lost to Blackpool - 2010 - 6 points
  2. =Watford lost to Palace - 2013
    =Derby lost to QPR - 2014 - 5 points
  3. =Palace lost to Leicester - 1996
    =Sheffield United lost to Wolves - 2003
    =Sheffield United lost to Burnley - 2009
    =Reading lost to Huddersfield - 2017 - 4 points
5 - More points = more likely to make the final

This is probably not a massive surprise, but the average points for teams making the final is 78.5, and for teams that don`t make the final is 76.4

6 - Teams finishing 3rd make the final 66.7% of the time
View attachment 210118


7 - Teams in 3rd get promoted 35% of the time - the team in 6th does not "always win the playoffs"

View attachment 210119

What does this tell us about this years playoffs?

ABSOLUTELY NOTHING :)
Sounds like an opportunity for us to set some new (unwanted) records…
 

Also in terms of points won on the pitch (sounding like Wilder here) the gap between us and Bristol City would be 24!

3-1 loss on aggregate 😭
 
Another one Selly ... think your final table includes this season in the not promoted column.

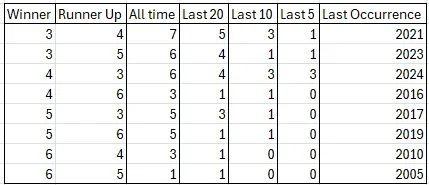
I've gone a bit mad with this, looking into the prevalence of all the various winner/runner up combinations. Firstly, while the team in 3rd has reached the final in 66% of overall play off campaigns, the number is increasing in recent years, accelerating after the plague years with all 5 most recent 3rd-placed teams making the final.
1746541888819.webp

The downside is that in the more recent years the team in 3rd has become less successful, losing three of the last 5 finals to the team finishing 4th.

1746541999461.webp

It's not that straightforward though, it never is. The times the team in 4th has prevailed since the plague, they have finished within a win of the team in 3rd. Both times there was a bigger gap, the team in 3rd won

1746542972377.webp

This season has, however, been really unusual as United in 3rd and particularly Sunderland in 4th have known exactly where they will finish for a number of weeks. Sunderland have lost 5 in a row.

Full breakdown of the finals:
1746542143893.webp

*in 1990/91 three teams were promoted automatically and therefore the play off teams were 4th to 7th. I have mapped them one higher (Notts County in 4th beat Brighton in 6th which is a 3/5 in the tables above)
**in 1994/95 one team was promoted automatically and therefore the play offs were contested by 2nd to 5th. Bolton in 3rd beat Reading in 2nd which is recorded as 4/3 above

I will however note that on the prior 2 occasions when a team achieved 90 points - they did not go up...
Good job we got 92 points then :)
 
**in 1994/95 one team was promoted automatically and therefore the play offs were contested by 2nd to 5th. Bolton in 3rd beat Reading in 2nd which is recorded as 4/3 above
That season is a bizarre one. As you say Reading finished second but did not go up automatically.

But they were second with 79 points. We really shit the bed that season. There was no way we should have missed the playoffs.
 
9 - most useless club in England at play offs- Sheffield United.
0- the amount of saves we have made a keeper make in all 4 finals
1- the most boring game of football ever seen at Wembley stadium in 2012 final with our squad of cowards who were unfit and had forgotten how to play football cos a disgrace of a bloke got sent down
 
That season is a bizarre one. As you say Reading finished second but did not go up automatically.

But they were second with 79 points. We really shit the bed that season. There was no way we should have missed the playoffs.

Was a very weird season that 94/95 one off memory we shit the bed in 2nd half of season
 
I decided to take a look back at all the 2nd tier playoff campaigns back to 1988/89 and draw out a number of facts - as follows:

1 - No team has finished with a greater points differential against their play of opponents that Sheffield United (24-25) - 22 Points

Top 5 points differentials
  1. Sheffield United vs Coventry - 2025 - 22 points
  2. Leeds United vs Coventry - 2024 - 17 points
  3. Sunderland vs Sheffield United - 1998 - 16 points
  4. Brighton vs Sheffield Wednesday (1990) - 2016 - 15 points
  5. =Bolton vs WBA - 2001
    =Derby vs Brighton - 2014
    =Fulham vs Derby - 2018 - 13 points

2 - No team has ever lost a playoff semi final to an opponent more than 15 points behind

Top 5 losing semi finalist points differentials
  1. Brighton lost to Sheffield Wednesday (1990) - 2016 - 15 points
  2. =Portsmouth lost to Leicester - 1993
    =Ipswich lost to WHU - 2005 - 12 points
  3. Wolves lost to Norwich - 2002 - 11 points
  4. Ipswich lost to Bolton - 1999 - 10 points
3 - No team has failed to make the final having achieved more than 89 points

Top 5 points totals for losing Semi finalists
  1. Brighton lost to Sheffield Wednesday (1990) - 2016 - 89 points
  2. Portsmouth lost to Leicester - 1993 - 88 points
  3. =Ipswich lost to Bolton - 1999 - 86 points
    =Wolves lost to Norwich - 2002 - 86 points
  4. Ipswich lost to WHU - 2005 - 85 points
4 - Having made the final - no team has lost to a team who finished more than 6 point behind them

Top 5 points differentials of losing finalists
  1. Cardiff lost to Blackpool - 2010 - 6 points
  2. =Watford lost to Palace - 2013
    =Derby lost to QPR - 2014 - 5 points
  3. =Palace lost to Leicester - 1996
    =Sheffield United lost to Wolves - 2003
    =Sheffield United lost to Burnley - 2009
    =Reading lost to Huddersfield - 2017 - 4 points
5 - More points = more likely to make the final

This is probably not a massive surprise, but the average points for teams making the final is 78.5, and for teams that don`t make the final is 76.4

6 - Teams finishing 3rd make the final 66.7% of the time
View attachment 210118


7 - Teams in 3rd get promoted 35% of the time - the team in 6th does not "always win the playoffs"

View attachment 210119

What does this tell us about this years playoffs?

ABSOLUTELY NOTHING :)
Sooooooo, it’s going to be a record breaking season for us in many ways.
 
Help me understand this please
At Hillsborough under the chairmanship from 1990 of Sir Dave Richards, the club company, Sheffield Wednesday Football Club Plc, was renamed Sheffield Wednesday Plc and became the holding company. A subsidiary company was named Sheffield Wednesday Football Club Ltd and the plc transferred to it – “hived down” – its whole “undertaking of a football club”: all the club’s assets, including Hillsborough, membership of the FA and Premier League, employment of all players and staff, and all liabilities except the debts to the Co-op Bank. The document announcing the restructuring and an initial £17m investment in the plc by a merchant bank, Charterhouse, with the aim of a stockmarket float in two or three years, explicitly stated that the FA rules would apply to the subsidiary company, not the plc.

It was this financially motivated reorganisation that created the structure the CPS ultimately found to consist of different companies, so that Sheffield Wednesday could not be charged.


David Conn in the Guardian covered the story: www.theguardian.com/football/2019/may/15/sheffield-wednesday-hillsborough-cannot-be-charged-graham-mackrell
 

Was a very weird season that 94/95 one off memory we shit the bed in 2nd half of season
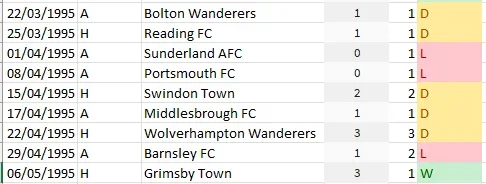
Not even the second half of the season - we were never really in with a shout of the title, but when we played Bolton away on 22 Mar the table looked like this:

1746696206141.webp

We then had the following results to the end of the season:

1746696278480.webp

I have no recollection of the home games against Reading and Swindon. I do remember Blake missed a sitter at Bolton, and we probably deserved a point at Sunderland. We were awful at Portsmouth and Barnsley.
 

All advertisments are hidden for logged in members, why not log in/register?

All advertisments are hidden for logged in members, why not log in/register?

Back
Top Bottom