XG, XGA, Xactly Blades XGraphs and XCharts Matchday 5

All advertisments are hidden for logged in members, why not log in/register?

ucandomagic

Well-Known Member
Joined
Dec 16, 2013
Messages
2,517
Reaction score
10,579
Location
Studley
As mentioned in my regular post after the Dull match, I have been asked to continue my review of Blades XG performance and general Championship XG stats.

This week's stats are now in from footballxg.com, so here we go:-

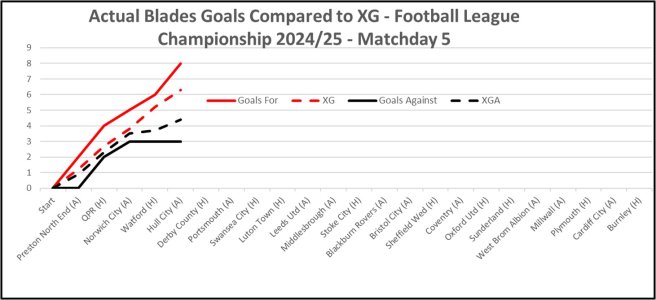
Graph 1 shows a comparison of the progress of our actual goals for and against with our XG expected goals for and against over our 5 games so far. XG says over those 5 games we should have scored 6.1 and conceded 4.4 and we have actually scored 8 and conceded 3, so we are performing better than average at both ends of the pitch for the chances that we are creating and allowing.

Graph 1:
XG Comparison - Matchday 5.jpg


Chart 1
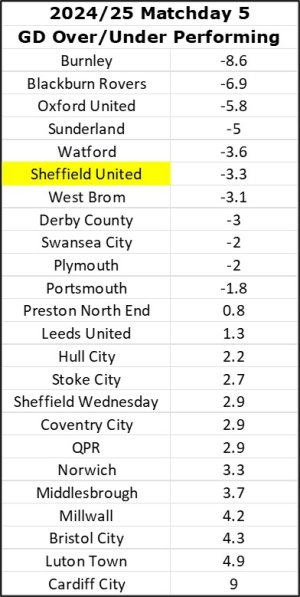
is a measure of over/under Championship performance based on general chances created/allowed. The numbers in Chart 1 are (XG-XGA) minus actual goal difference, in other words a comparison of your actual goal difference against your expected goal difference. The detail of this doesn't matter, but in my mind the top third of this chart are overperforming and could be expected to slip down in league position, unless they have an exceptionally clinical strikeforce and/or an exceptional goalkeeper. The middle third are probably matching the chances they create and allow, and the bottom third are underperforming and could be expected to move up the league unless they have a particularly poor strikeforce and/or a particularly weak goalkeeper.

Chart 1:
XG Over Under Matchday 5.jpg


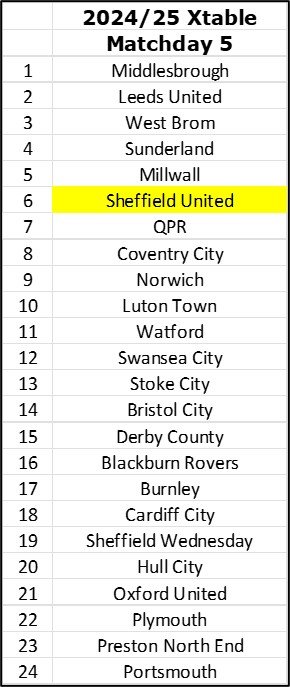
So, performance-wise, the Blades actual results are doing slightly better than their XG performance. The difference has increased this week as against Hull we had an XG of 1.0 and an XGA of 0.7 in a game that we won 2-0. Burnley on the other hand have scored 11 goals with an XG of 4.1 and conceded 3 goals with an XGA of 4.7 which is unsustainable. That is reflected in Chart 2, which is the XTable - based on team XG's in matches played. In The XTable Burnley are 17th, compared to 3rd in the actual League Table. Blades are 6th in the XTable, which doesn't allow for the 2-point deduction, but is the same as our actual 6th place with the deduction, which would be 4th place without the deduction.

Chart 2:
XTable Matchday 5.jpg

So, overall the stats would suggest that our results are a reasonably accurate reflection of our XG performance and represent a solid playoff position. Teams like Burnley, Blackburn and Oxford are probably significantly overchieving against their performance and might be expected to slip back a bit, whereas teams like Cardiff and Luton are significantly underachieving against their performance and would be expected to move up the table. Cardiff’s stats are amazing – scored 1 and conceded 11 compared to an XG of 4 and an XGA of 5 -suggesting that their midfield is performing OK but their strikers and keeper are performing really badly.

So that’s it for another week – hopefully it’s still of interest and not too geeky!

UTB & Slava Ukraini - RIP Jonny (Thank you for all the fun we always had watching your work).
 

Will be interesting to see how good or bad a predictor the xg/xga stuff is as more data is assembled through the season. Either way it's good looking at these charts and graphs, particularly while we seem to be doing well!
Thanks for doing the work!
 
The difference has increased this week as against Hull we had an XG of 1.0 and an XGA of 0.7 in a game that we won 2-0.


Awesome work again ucandomagic 🔥

Can I ask where ur getting ur xG and xGA from.. as the couple of places I've seen had us with an xG of just 0.7 and an xGA of 1.3 vs Hull.

Cheers again!
 
As mentioned in my regular post after the Dull match, I have been asked to continue my review of Blades XG performance and general Championship XG stats.

This week's stats are now in from footballxg.com, so here we go:-

Graph 1 shows a comparison of the progress of our actual goals for and against with our XG expected goals for and against over our 5 games so far. XG says over those 5 games we should have scored 6.1 and conceded 4.4 and we have actually scored 8 and conceded 3, so we are performing better than average at both ends of the pitch for the chances that we are creating and allowing.

Graph 1:
View attachment 193020


Chart 1
is a measure of over/under Championship performance based on general chances created/allowed. The numbers in Chart 1 are (XG-XGA) minus actual goal difference, in other words a comparison of your actual goal difference against your expected goal difference. The detail of this doesn't matter, but in my mind the top third of this chart are overperforming and could be expected to slip down in league position, unless they have an exceptionally clinical strikeforce and/or an exceptional goalkeeper. The middle third are probably matching the chances they create and allow, and the bottom third are underperforming and could be expected to move up the league unless they have a particularly poor strikeforce and/or a particularly weak goalkeeper.

Chart 1:
View attachment 193021


So, performance-wise, the Blades actual results are doing slightly better than their XG performance. The difference has increased this week as against Hull we had an XG of 1.0 and an XGA of 0.7 in a game that we won 2-0. Burnley on the other hand have scored 11 goals with an XG of 4.1 and conceded 3 goals with an XGA of 4.7 which is unsustainable. That is reflected in Chart 2, which is the XTable - based on team XG's in matches played. In The XTable Burnley are 17th, compared to 3rd in the actual League Table. Blades are 6th in the XTable, which doesn't allow for the 2-point deduction, but is the same as our actual 6th place with the deduction, which would be 4th place without the deduction.

Chart 2:
View attachment 193022

So, overall the stats would suggest that our results are a reasonably accurate reflection of our XG performance and represent a solid playoff position. Teams like Burnley, Blackburn and Oxford are probably significantly overchieving against their performance and might be expected to slip back a bit, whereas teams like Cardiff and Luton are significantly underachieving against their performance and would be expected to move up the table. Cardiff’s stats are amazing – scored 1 and conceded 11 compared to an XG of 4 and an XGA of 5 -suggesting that their midfield is performing OK but their strikers and keeper are performing really badly.

So that’s it for another week – hopefully it’s still of interest and not too geeky!

UTB & Slava Ukraini - RIP Jonny (Thank you for all the fun we always had watching your work).

Nice numbers as ever Graphman and nice words about Jonny. How many away games that we couldn’t make have we felt a part of by watching Jonny’s work❤️?

I noticed that jono_t2000 asked where you got your stats - I can answer for you as the answer is already at the beginning of your post - footballxg.com.

Keep plotting, stay happy and make sure you get that Pigs line on your main post graph after Matchday 6!

UTB & FTP!
 
Thanks ucandomagic , I enjoy reading these analyses.

The XG stats seem to confirm what we’re seeing with the eye-test so far this season - that we’re operating at a decent top-six level. We’re solid at the back but we’re not carving teams open. I believe that, barring injuries, our game will start to click more as we go through the season, so I’m pretty optimistic.

I know we’re slightly over performing our xG as per the stats (which is interesting when many are complaining we don’t have a goalscorer) but tbh it’s well within the bounds of statistical error. I tend to think our xG is underplaying things a little for us anyway - our style of play with three dribblers at the top of the pitch means we have an awful lot of “almost” chances (eg balls flashing across the box, pull backs in 6 yard box that are intercepted) which are actually very dangerous but register as zero xG because no shot is actually hit. I might be over thinking it but I find this stuff interesting :-).

Do they also have ‘big chance creation’ stats? I sometimes prefer that to xG as a guide to whether a team is dominant or not.

Other thing to consider is that we really have had a gentle start to the season, which will be even more true after the next two games.
 
Nice numbers as ever Graphman and nice words about Jonny. How many away games that we couldn’t make have we felt a part of by watching Jonny’s work❤️?

I noticed that jono_t2000 asked where you got your stats - I can answer for you as the answer is already at the beginning of your post - footballxg.com.

Keep plotting, stay happy and make sure you get that Pigs line on your main post graph after Matchday 6!

UTB & FTP!

Cheers for this 🙂

Never used footballxg before so will have to check it out!
 
So, my question would be "Can you isolate xG to a game by game basis?"

I don't think adding xG across multiple games makes sense - the wasted xG for underperformance or the bonus xG for overperformance doesn't carry over to the next match. An xG of 1.5 should (in theory) normally result in 1 or 2 goals
I have the opposite view, over a period of time it’s a good measure and those who outperform xG over a longer period of time have clinical finishers but aren’t necessarily playing well.

On an individual game basis it’s a bit of a meaningless stat, a penalty miss for example would skew the xG as it’s a 0.7 xG or whatever it is.

I’d say the xG of the 2 goals we scored at Hull would be low so we may have overperformed in that particular game with 2 excellent finishes and not a lot else in terms of clear cut chances.
 
As mentioned in my regular post after the Dull match, I have been asked to continue my review of Blades XG performance and general Championship XG stats.

This week's stats are now in from footballxg.com, so here we go:-

Graph 1 shows a comparison of the progress of our actual goals for and against with our XG expected goals for and against over our 5 games so far. XG says over those 5 games we should have scored 6.1 and conceded 4.4 and we have actually scored 8 and conceded 3, so we are performing better than average at both ends of the pitch for the chances that we are creating and allowing.

Graph 1:
View attachment 193020


Chart 1
is a measure of over/under Championship performance based on general chances created/allowed. The numbers in Chart 1 are (XG-XGA) minus actual goal difference, in other words a comparison of your actual goal difference against your expected goal difference. The detail of this doesn't matter, but in my mind the top third of this chart are overperforming and could be expected to slip down in league position, unless they have an exceptionally clinical strikeforce and/or an exceptional goalkeeper. The middle third are probably matching the chances they create and allow, and the bottom third are underperforming and could be expected to move up the league unless they have a particularly poor strikeforce and/or a particularly weak goalkeeper.

Chart 1:
View attachment 193021


So, performance-wise, the Blades actual results are doing slightly better than their XG performance. The difference has increased this week as against Hull we had an XG of 1.0 and an XGA of 0.7 in a game that we won 2-0. Burnley on the other hand have scored 11 goals with an XG of 4.1 and conceded 3 goals with an XGA of 4.7 which is unsustainable. That is reflected in Chart 2, which is the XTable - based on team XG's in matches played. In The XTable Burnley are 17th, compared to 3rd in the actual League Table. Blades are 6th in the XTable, which doesn't allow for the 2-point deduction, but is the same as our actual 6th place with the deduction, which would be 4th place without the deduction.

Chart 2:
View attachment 193022

So, overall the stats would suggest that our results are a reasonably accurate reflection of our XG performance and represent a solid playoff position. Teams like Burnley, Blackburn and Oxford are probably significantly overchieving against their performance and might be expected to slip back a bit, whereas teams like Cardiff and Luton are significantly underachieving against their performance and would be expected to move up the table. Cardiff’s stats are amazing – scored 1 and conceded 11 compared to an XG of 4 and an XGA of 5 -suggesting that their midfield is performing OK but their strikers and keeper are performing really badly.

So that’s it for another week – hopefully it’s still of interest and not too geeky!

UTB & Slava Ukraini - RIP Jonny (Thank you for all the fun we always had watching your work).
I love this 🙌

Look forward to reading it in detail
 
I have the opposite view, over a period of time it’s a good measure and those who outperform xG over a longer period of time have clinical finishers but aren’t necessarily playing well.

On an individual game basis it’s a bit of a meaningless stat, a penalty miss for example would skew the xG as it’s a 0.7 xG or whatever it is.

I’d say the xG of the 2 goals we scored at Hull would be low so we may have overperformed in that particular game with 2 excellent finishes and not a lot else in terms of clear cut chances.
But those fractions of goals (gained or lost) don't carry over. If you have an xG of x.2 and score x goals, the .2 doesn't have any impact on the next game.

I can see the value of xG for coaching (looking to make better chances), but I'm not sure low xG converts to 'not playing well', especially if you are still winning
Agreed with the idea that it doesn’t carry over game to game and also that you can play well and not create high xG numbers, I also think that over a season if you’ve created say 20 xG less than a rival (net xG so for - against) it’s realistic to expect that they’ll finish above you, unless you have players in the team with exceptional finishing ability and the rivals don’t.
 
As mentioned in my regular post after the Dull match, I have been asked to continue my review of Blades XG performance and general Championship XG stats.

This week's stats are now in from footballxg.com, so here we go:-

Graph 1 shows a comparison of the progress of our actual goals for and against with our XG expected goals for and against over our 5 games so far. XG says over those 5 games we should have scored 6.1 and conceded 4.4 and we have actually scored 8 and conceded 3, so we are performing better than average at both ends of the pitch for the chances that we are creating and allowing.

Graph 1:
View attachment 193020


Chart 1
is a measure of over/under Championship performance based on general chances created/allowed. The numbers in Chart 1 are (XG-XGA) minus actual goal difference, in other words a comparison of your actual goal difference against your expected goal difference. The detail of this doesn't matter, but in my mind the top third of this chart are overperforming and could be expected to slip down in league position, unless they have an exceptionally clinical strikeforce and/or an exceptional goalkeeper. The middle third are probably matching the chances they create and allow, and the bottom third are underperforming and could be expected to move up the league unless they have a particularly poor strikeforce and/or a particularly weak goalkeeper.

Chart 1:
View attachment 193021


So, performance-wise, the Blades actual results are doing slightly better than their XG performance. The difference has increased this week as against Hull we had an XG of 1.0 and an XGA of 0.7 in a game that we won 2-0. Burnley on the other hand have scored 11 goals with an XG of 4.1 and conceded 3 goals with an XGA of 4.7 which is unsustainable. That is reflected in Chart 2, which is the XTable - based on team XG's in matches played. In The XTable Burnley are 17th, compared to 3rd in the actual League Table. Blades are 6th in the XTable, which doesn't allow for the 2-point deduction, but is the same as our actual 6th place with the deduction, which would be 4th place without the deduction.

Chart 2:
View attachment 193022

So, overall the stats would suggest that our results are a reasonably accurate reflection of our XG performance and represent a solid playoff position. Teams like Burnley, Blackburn and Oxford are probably significantly overchieving against their performance and might be expected to slip back a bit, whereas teams like Cardiff and Luton are significantly underachieving against their performance and would be expected to move up the table. Cardiff’s stats are amazing – scored 1 and conceded 11 compared to an XG of 4 and an XGA of 5 -suggesting that their midfield is performing OK but their strikers and keeper are performing really badly.

So that’s it for another week – hopefully it’s still of interest and not too geeky!

UTB & Slava Ukraini - RIP Jonny (Thank you for all the fun we always had watching your work).
Fabulous stuff, many thanks. I'm getting more and more into the stats side of football
 

All advertisments are hidden for logged in members, why not log in/register?

All advertisments are hidden for logged in members, why not log in/register?

Back
Top Bottom