ucandomagic
Well-Known Member
As mentioned in my regular post after the Dull match, I have been asked to continue my review of Blades XG performance and general Championship XG stats.
This week's stats are now in from footballxg.com, so here we go:-
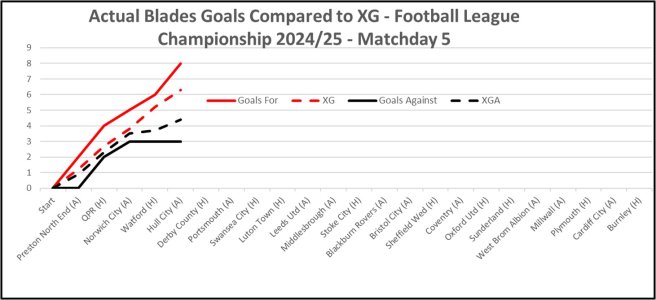
Graph 1 shows a comparison of the progress of our actual goals for and against with our XG expected goals for and against over our 5 games so far. XG says over those 5 games we should have scored 6.1 and conceded 4.4 and we have actually scored 8 and conceded 3, so we are performing better than average at both ends of the pitch for the chances that we are creating and allowing.
Graph 1:

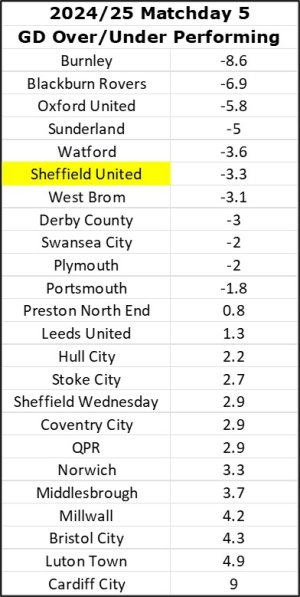
Chart 1 is a measure of over/under Championship performance based on general chances created/allowed. The numbers in Chart 1 are (XG-XGA) minus actual goal difference, in other words a comparison of your actual goal difference against your expected goal difference. The detail of this doesn't matter, but in my mind the top third of this chart are overperforming and could be expected to slip down in league position, unless they have an exceptionally clinical strikeforce and/or an exceptional goalkeeper. The middle third are probably matching the chances they create and allow, and the bottom third are underperforming and could be expected to move up the league unless they have a particularly poor strikeforce and/or a particularly weak goalkeeper.
Chart 1:

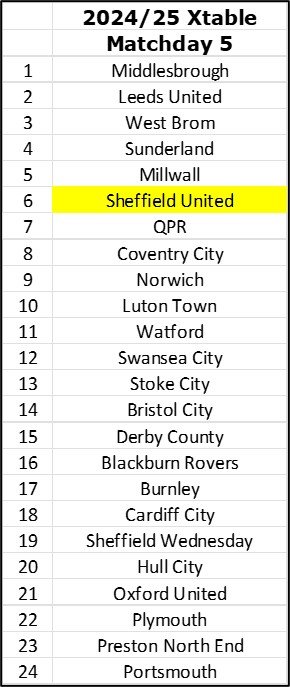
So, performance-wise, the Blades actual results are doing slightly better than their XG performance. The difference has increased this week as against Hull we had an XG of 1.0 and an XGA of 0.7 in a game that we won 2-0. Burnley on the other hand have scored 11 goals with an XG of 4.1 and conceded 3 goals with an XGA of 4.7 which is unsustainable. That is reflected in Chart 2, which is the XTable - based on team XG's in matches played. In The XTable Burnley are 17th, compared to 3rd in the actual League Table. Blades are 6th in the XTable, which doesn't allow for the 2-point deduction, but is the same as our actual 6th place with the deduction, which would be 4th place without the deduction.
Chart 2:

So, overall the stats would suggest that our results are a reasonably accurate reflection of our XG performance and represent a solid playoff position. Teams like Burnley, Blackburn and Oxford are probably significantly overchieving against their performance and might be expected to slip back a bit, whereas teams like Cardiff and Luton are significantly underachieving against their performance and would be expected to move up the table. Cardiff’s stats are amazing – scored 1 and conceded 11 compared to an XG of 4 and an XGA of 5 -suggesting that their midfield is performing OK but their strikers and keeper are performing really badly.
So that’s it for another week – hopefully it’s still of interest and not too geeky!
UTB & Slava Ukraini - RIP Jonny (Thank you for all the fun we always had watching your work).
This week's stats are now in from footballxg.com, so here we go:-
Graph 1 shows a comparison of the progress of our actual goals for and against with our XG expected goals for and against over our 5 games so far. XG says over those 5 games we should have scored 6.1 and conceded 4.4 and we have actually scored 8 and conceded 3, so we are performing better than average at both ends of the pitch for the chances that we are creating and allowing.
Graph 1:

Chart 1 is a measure of over/under Championship performance based on general chances created/allowed. The numbers in Chart 1 are (XG-XGA) minus actual goal difference, in other words a comparison of your actual goal difference against your expected goal difference. The detail of this doesn't matter, but in my mind the top third of this chart are overperforming and could be expected to slip down in league position, unless they have an exceptionally clinical strikeforce and/or an exceptional goalkeeper. The middle third are probably matching the chances they create and allow, and the bottom third are underperforming and could be expected to move up the league unless they have a particularly poor strikeforce and/or a particularly weak goalkeeper.
Chart 1:

So, performance-wise, the Blades actual results are doing slightly better than their XG performance. The difference has increased this week as against Hull we had an XG of 1.0 and an XGA of 0.7 in a game that we won 2-0. Burnley on the other hand have scored 11 goals with an XG of 4.1 and conceded 3 goals with an XGA of 4.7 which is unsustainable. That is reflected in Chart 2, which is the XTable - based on team XG's in matches played. In The XTable Burnley are 17th, compared to 3rd in the actual League Table. Blades are 6th in the XTable, which doesn't allow for the 2-point deduction, but is the same as our actual 6th place with the deduction, which would be 4th place without the deduction.
Chart 2:

So, overall the stats would suggest that our results are a reasonably accurate reflection of our XG performance and represent a solid playoff position. Teams like Burnley, Blackburn and Oxford are probably significantly overchieving against their performance and might be expected to slip back a bit, whereas teams like Cardiff and Luton are significantly underachieving against their performance and would be expected to move up the table. Cardiff’s stats are amazing – scored 1 and conceded 11 compared to an XG of 4 and an XGA of 5 -suggesting that their midfield is performing OK but their strikers and keeper are performing really badly.
So that’s it for another week – hopefully it’s still of interest and not too geeky!
UTB & Slava Ukraini - RIP Jonny (Thank you for all the fun we always had watching your work).
