XG, XGA, Xactly Blades Graphs and Charts

All advertisments are hidden for logged in members, why not log in/register?

ucandomagic

Well-Known Member
Joined
Dec 16, 2013
Messages
2,514
Reaction score
10,529
Location
Studley
Each week I post actual results graphs and charts reviewing our progress and performance, but I've been asked by a few people , Bladezz and ThirdGenBlade, about how we are doing XG-wise.

I'm always a little sceptical about XG but, because it uses average scoring probabilites, comparing actual goals for and against XG and XGA is probably a reasonable assessment of your efficiency at both ends. Anyway, just to see if people think it's worth doing I've put together a couple of simple things below which people can let me know if they want me to continue with. I've got the stats from footballxg.com.

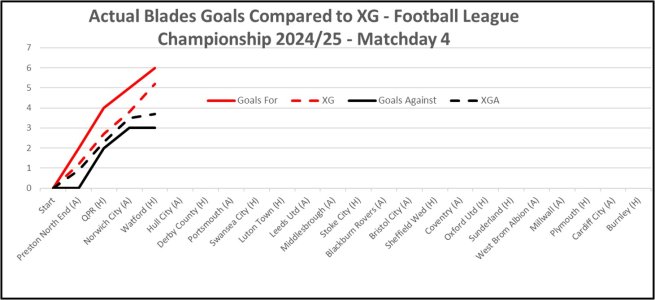
Graph 1 shows a comparison of the progress of our actual goals for and against against our XG expected goals for and against over our 4 games so far. XG says over those 4 games we should have scored 5.2 and conceded 3.7 and we have scored 6 and conceded 3, so we are performing slightly better than average at both ends for the chances we are creating and allowing.

Graph 1:
XG Comparison - Matchday 4.jpg


Chart 1
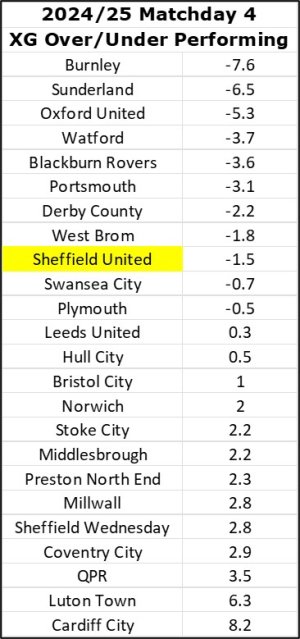
is a measure of over/under Championship performance based on general chances created/allowed. The numbers in Chart 1 are (XG-XGA) minus actual goal difference, in other words a comparison of your actual goal difference against your expected goal difference. The detail of this doesn't matter, but in my mind the top third of this chart are overperforming and could be expected to slip down in league position, unless they have an exceptionally clinical strikeforce and/or an exceptional goalkeeper. The middle third are probably matching the chances they create and allow, and the bottom third are underperforming and could be expected to move up the league unless they have a particularly poor strikeforce and/or a particularly weak goalkeeper.

Chart 1:
XG Over Under Matchday 4.jpg


So, performance-wise, the Blades results are pretty accurately reflecting their performance. Burnley on the other hand have scored 10 goals with an XG of 3.1, which is unsustainable. That is reflected in Chart 2, which is the XTable - based on team XG's in matches played. In The XTable Burnley are 18th, compared to 6th in the actual League Table. Blades are 7th in the XTable, which doesn't allow for the 2-point deduction, but is a realistic reflection of our actual 8th place with the deduction, which would be 5th without the deduction.

Chart 2:
XTable Matchday 4.jpg

So, overall the stats would suggest that our results are a reasonably accurate reflection of our performance and represent a solid playoff position. Teams like Burnley, Oxford and Sunderland are probably significantly overchieving against their performance and might be expected to slip back a bit, whereas teams like Cardiff and Luton are significanlty underachieving against their performance and would be expected to move up the table.

Anyway, let me know if you want me to carry on with this - I'll always keep it separate from the actual match review graphs and charts to prevent the posts getting too big!

UTB & Slava Ukraini - and hoping the Blades get a "Dull" victory on Friday!
 

Good analysis, I think over a few months xG gives an indication as to how well you’re doing, over a few games it’s perhaps too isolated a sample to be meaningful. Be interesting to see how this develops as the season goes on, particularly given our lack of depth in the striker department.
 
Each week I post actual results graphs and charts reviewing our progress and performance, but I've been asked by a few people , Bladezz and ThirdGenBlade, about how we are doing XG-wise.

I'm always a little sceptical about XG but, because it uses average scoring probabilites, comparing actual goals for and against XG and XGA is probably a reasonable assessment of your efficiency at both ends. Anyway, just to see if people think it's worth doing I've put together a couple of simple things below which people can let me know if they want me to continue with. I've got the stats from footballxg.com.

Graph 1 shows a comparison of the progress of our actual goals for and against against our XG expected goals for and against over our 4 games so far. XG says over those 4 games we should have scored 5.2 and conceded 3.7 and we have scored 6 and conceded 3, so we are performing slightly better than average at both ends for the chances we are creating and allowing.

Graph 1:
View attachment 192178


Chart 1
is a measure of over/under Championship performance based on general chances created/allowed. The numbers in Chart 1 are (XG-XGA) minus actual goal difference, in other words a comparison of your actual goal difference against your expected goal difference. The detail of this doesn't matter, but in my mind the top third of this chart are overperforming and could be expected to slip down in league position, unless they have an exceptionally clinical strikeforce and/or an exceptional goalkeeper. The middle third are probably matching the chances they create and allow, and the bottom third are underperforming and could be expected to move up the league unless they have a particularly poor strikeforce and/or a particularly weak goalkeeper.

Chart 1:
View attachment 192179


So, performance-wise, the Blades results are pretty accurately reflecting their performance. Burnley on the other hand have scored 10 goals with an XG of 3.1, which is unsustainable. That is reflected in Chart 2, which is the XTable - based on team XG's in matches played. In The XTable Burnley are 18th, compared to 6th in the actual League Table. Blades are 7th in the XTable, which doesn't allow for the 2-point deduction, but is a realistic reflection of our actual 8th place with the deduction, which would be 5th without the deduction.

Chart 2:
View attachment 192180

So, overall the stats would suggest that our results are a reasonably accurate reflection of our performance and represent a solid playoff position. Teams like Burnley, Oxford and Sunderland are probably significantly overchieving against their performance and might be expected to slip back a bit, whereas teams like Cardiff and Luton are significanlty underachieving against their performance and would be expected to move up the table.

Anyway, let me know if you want me to carry on with this - I'll always keep it separate from the actual match review graphs and charts to prevent the posts getting too big!

UTB & Slava Ukraini - and hoping the Blades get a "Dull" victory on Friday!
I would bet on Burnley regressing a bit, but they have form for handily exceeding their Xg. Two seasons ago they scored 87 goals against an Xg of 66, which is significant over performance.

Nathan Tella scored 17 goals from 10xg, and Manuel
benson 11 goals from 4xg. Benson in particular scored a number of fluke goals.
 
You can do good stats stuff ucando!
I'd like to see these carry on through the season but only you know how much time it'll take.
 
Cheers for taking the time to do this, I find it very interesting so would definitely be happy if you carried on spending the time doing it!
 
Each week I post actual results graphs and charts reviewing our progress and performance, but I've been asked by a few people , Bladezz and ThirdGenBlade, about how we are doing XG-wise.

I'm always a little sceptical about XG but, because it uses average scoring probabilites, comparing actual goals for and against XG and XGA is probably a reasonable assessment of your efficiency at both ends. Anyway, just to see if people think it's worth doing I've put together a couple of simple things below which people can let me know if they want me to continue with. I've got the stats from footballxg.com.

Graph 1 shows a comparison of the progress of our actual goals for and against against our XG expected goals for and against over our 4 games so far. XG says over those 4 games we should have scored 5.2 and conceded 3.7 and we have scored 6 and conceded 3, so we are performing slightly better than average at both ends for the chances we are creating and allowing.

Graph 1:
View attachment 192178


Chart 1
is a measure of over/under Championship performance based on general chances created/allowed. The numbers in Chart 1 are (XG-XGA) minus actual goal difference, in other words a comparison of your actual goal difference against your expected goal difference. The detail of this doesn't matter, but in my mind the top third of this chart are overperforming and could be expected to slip down in league position, unless they have an exceptionally clinical strikeforce and/or an exceptional goalkeeper. The middle third are probably matching the chances they create and allow, and the bottom third are underperforming and could be expected to move up the league unless they have a particularly poor strikeforce and/or a particularly weak goalkeeper.

Chart 1:
View attachment 192179


So, performance-wise, the Blades results are pretty accurately reflecting their performance. Burnley on the other hand have scored 10 goals with an XG of 3.1, which is unsustainable. That is reflected in Chart 2, which is the XTable - based on team XG's in matches played. In The XTable Burnley are 18th, compared to 6th in the actual League Table. Blades are 7th in the XTable, which doesn't allow for the 2-point deduction, but is a realistic reflection of our actual 8th place with the deduction, which would be 5th without the deduction.

Chart 2:
View attachment 192180

So, overall the stats would suggest that our results are a reasonably accurate reflection of our performance and represent a solid playoff position. Teams like Burnley, Oxford and Sunderland are probably significantly overchieving against their performance and might be expected to slip back a bit, whereas teams like Cardiff and Luton are significanlty underachieving against their performance and would be expected to move up the table.

Anyway, let me know if you want me to carry on with this - I'll always keep it separate from the actual match review graphs and charts to prevent the posts getting too big!

UTB & Slava Ukraini - and hoping the Blades get a "Dull" victory on Friday!
That’s absolutely amazing!

Would give 2 likes if possible. Excellent work and a great read.
 
Each week I post actual results graphs and charts reviewing our progress and performance, but I've been asked by a few people , Bladezz and ThirdGenBlade, about how we are doing XG-wise.

I'm always a little sceptical about XG but, because it uses average scoring probabilites, comparing actual goals for and against XG and XGA is probably a reasonable assessment of your efficiency at both ends. Anyway, just to see if people think it's worth doing I've put together a couple of simple things below which people can let me know if they want me to continue with. I've got the stats from footballxg.com.

Graph 1 shows a comparison of the progress of our actual goals for and against against our XG expected goals for and against over our 4 games so far. XG says over those 4 games we should have scored 5.2 and conceded 3.7 and we have scored 6 and conceded 3, so we are performing slightly better than average at both ends for the chances we are creating and allowing.

Graph 1:
View attachment 192178


Chart 1
is a measure of over/under Championship performance based on general chances created/allowed. The numbers in Chart 1 are (XG-XGA) minus actual goal difference, in other words a comparison of your actual goal difference against your expected goal difference. The detail of this doesn't matter, but in my mind the top third of this chart are overperforming and could be expected to slip down in league position, unless they have an exceptionally clinical strikeforce and/or an exceptional goalkeeper. The middle third are probably matching the chances they create and allow, and the bottom third are underperforming and could be expected to move up the league unless they have a particularly poor strikeforce and/or a particularly weak goalkeeper.

Chart 1:
View attachment 192179


So, performance-wise, the Blades results are pretty accurately reflecting their performance. Burnley on the other hand have scored 10 goals with an XG of 3.1, which is unsustainable. That is reflected in Chart 2, which is the XTable - based on team XG's in matches played. In The XTable Burnley are 18th, compared to 6th in the actual League Table. Blades are 7th in the XTable, which doesn't allow for the 2-point deduction, but is a realistic reflection of our actual 8th place with the deduction, which would be 5th without the deduction.

Chart 2:
View attachment 192180

So, overall the stats would suggest that our results are a reasonably accurate reflection of our performance and represent a solid playoff position. Teams like Burnley, Oxford and Sunderland are probably significantly overchieving against their performance and might be expected to slip back a bit, whereas teams like Cardiff and Luton are significanlty underachieving against their performance and would be expected to move up the table.

Anyway, let me know if you want me to carry on with this - I'll always keep it separate from the actual match review graphs and charts to prevent the posts getting too big!

UTB & Slava Ukraini - and hoping the Blades get a "Dull" victory on Friday!
Fuck me Graphman - or should I call you XG-raphman now? You nick my ideas and take all the credit!

Seriously though - this is great. People say we need a striker and we need a CB - but we’re beating the stats on putting away and keeping out the chances that our really good midfield are creating and allowing.

Keep it quiet, we don’t want to spoil people on here’s fun, but we might just have the makings of a fucking good team. Shush!

UTB & FTP
 
Excellent analysis, and flawed though it is, xG is still a fairly decent predictor of performance. One thing to always remember with xG though, is that it is based on shots, and ignores anything that doesn't result in a shot. The two examples below illustrate this:

1. Team A plays a series of 25 passes, carving open the opposition. The final pass sends Team A's striker through on goal in a 80-20 with the goalkeeper. If the striker gets there first, it's an almost guaranteed goal. However, somehow the goalkeeper manages to get his toe on it first. No shot. xG = 0.

2. Team B have struggled all game. In frustration, one of their midfielders tries a long shot from the halfway line. It goes 30 feet wide to whistles and jeers from the crowd. xG = 0.02.

In those cases, clearly example 1 was a much better 'chance', but it doesn't register on the xG scale, whereas example 2 does. Likewise with cases like last-ditch intercepted passes that stop a goal (xG = 0), bad passes that 9 times out of 10 would have resulted in a goal but didn't because the assister fluffed it up, etc. Nevertheless, xG is probably a better predictor than any other metrics, so it's a worthwhile analysis - thanks!
 
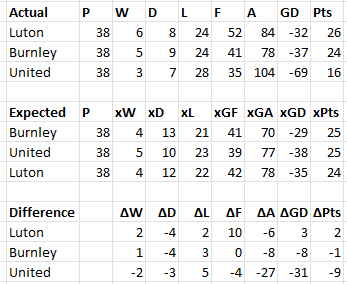
I did some analysis of the performance against xG of the three promoted sides last season. In the table below, I compared the results for each game against the expected result with the xGs rounded to the nearest integer. As an example, our game against Chelsea finished 2-2 on an xG of 1.4-0.3 which means that statistically it should have been 1-0 to us.

We were staggeringly bad. To the point that I very much doubt that any other side will be as bad for decades. Burnley were roughly in line with expecations while Luton did better, particularly in terms of goals scored.

1725613026307.png
 
I did some analysis of the performance against xG of the three promoted sides last season. In the table below, I compared the results for each game against the expected result with the xGs rounded to the nearest integer. As an example, our game against Chelsea finished 2-2 on an xG of 1.4-0.3 which means that statistically it should have been 1-0 to us.

We were staggeringly bad. To the point that I very much doubt that any other side will be as bad for decades. Burnley were roughly in line with expecations while Luton did better, particularly in terms of goals scored.

View attachment 192231

That's horrible.

A good chunk of that is the historically bad performances of Grbic, who conceded a goal a game more than he should have per Xg.
 
I find these stats fascinating and love to see them. Not sure if it gives me hope or pessimism at times but certainly be happy for you to continue if you can spend the time

Slava Ukraini !!
 
That's horrible.

A good chunk of that is the historically bad performances of Grbic, who conceded a goal a game more than he should have per Xg.
Foderingham doesn't come out particularly well either. In his 29 games we conceded 16 more goals than we should have. Not Grbic levels (11 worse in 9) but still bad.

The split in the worst 10 games was similar, Foderingham in for 7 and Grbic for 3.

1725616160409.png
 
I know there is a nature to xG but I’ve never got that fact that xG of setting up a chance for Basham vs xG of setting up a chance for Sharp would be the same.

I’d have thought they could have evolved the measure to incorporate they players you are creating chances for.

It’s far more accurate to suggest “he should have scored that” if a chance falls to a player who regularly does score in those positions rather than a player who doesn’t.

If the chances are falling to the wrong players then the expected goals are not really the expected goals, unless the player falls right into the middle of the conversion rates. I thought they should have evolved the model to incorporate that. But it seems on one hand you’re expected to embrace this imaginary figure yet on the other you get criticised for suggesting it should be improved.
 
I did some analysis of the performance against xG of the three promoted sides last season. In the table below, I compared the results for each game against the expected result with the xGs rounded to the nearest integer. As an example, our game against Chelsea finished 2-2 on an xG of 1.4-0.3 which means that statistically it should have been 1-0 to us.

We were staggeringly bad. To the point that I very much doubt that any other side will be as bad for decades. Burnley were roughly in line with expecations while Luton did better, particularly in terms of goals scored.

View attachment 192231
There's some issues with your maths here in the deltas

3-4 is not -2
7-12 is not -3
28-22 is not 5

Rounding errors?
 

Excellent analysis, and flawed though it is, xG is still a fairly decent predictor of performance. One thing to always remember with xG though, is that it is based on shots, and ignores anything that doesn't result in a shot. The two examples below illustrate this:

Cutting the examples for brevity, but I believe that some people do compile expected assists, which would go some way to plugging the gap for your first example
 
There's some issues with your maths here in the deltas

3-4 is not -2
7-12 is not -3
28-22 is not 5

Rounding errors?
No issues with the deltas: the actual and expected are in table order. Luton should have finished bottom, United 2nd bottom and Burnley 3rd bottom.

1725620381602.png
Is that easier to read?
 
Good analysis, I think over a few months xG gives an indication as to how well you’re doing, over a few games it’s perhaps too isolated a sample to be meaningful. Be interesting to see how this develops as the season goes on, particularly given our lack of depth in the striker department.
Fortunately (or not) how well we are doing relates only to points achieved.
Other aspects may give the coaching staff some insight, but members of this forum ????
 
Points tell you how many you’re winning, although it’s a results business there are other indicators of ‘good performance’ than simply winning. It’s perfectly possible to play well and lose as well as the opposite.
 
Cutting the examples for brevity, but I believe that some people do compile expected assists, which would go some way to plugging the gap for your first example

I think that the expected assists are still based on shots. If Player X passes to Player Y, who gets a 0.30 xG shot away, Play X gets 0.30 xA. However, if they played an almost-perfect through ball that just got intercepted against all odds, it would be 0 xA.
 
Each week I post actual results graphs and charts reviewing our progress and performance, but I've been asked by a few people , Bladezz and ThirdGenBlade, about how we are doing XG-wise.

I'm always a little sceptical about XG but, because it uses average scoring probabilites, comparing actual goals for and against XG and XGA is probably a reasonable assessment of your efficiency at both ends. Anyway, just to see if people think it's worth doing I've put together a couple of simple things below which people can let me know if they want me to continue with. I've got the stats from footballxg.com.

Graph 1 shows a comparison of the progress of our actual goals for and against against our XG expected goals for and against over our 4 games so far. XG says over those 4 games we should have scored 5.2 and conceded 3.7 and we have scored 6 and conceded 3, so we are performing slightly better than average at both ends for the chances we are creating and allowing.

Graph 1:
View attachment 192178


Chart 1
is a measure of over/under Championship performance based on general chances created/allowed. The numbers in Chart 1 are (XG-XGA) minus actual goal difference, in other words a comparison of your actual goal difference against your expected goal difference. The detail of this doesn't matter, but in my mind the top third of this chart are overperforming and could be expected to slip down in league position, unless they have an exceptionally clinical strikeforce and/or an exceptional goalkeeper. The middle third are probably matching the chances they create and allow, and the bottom third are underperforming and could be expected to move up the league unless they have a particularly poor strikeforce and/or a particularly weak goalkeeper.

Chart 1:
View attachment 192179


So, performance-wise, the Blades results are pretty accurately reflecting their performance. Burnley on the other hand have scored 10 goals with an XG of 3.1, which is unsustainable. That is reflected in Chart 2, which is the XTable - based on team XG's in matches played. In The XTable Burnley are 18th, compared to 6th in the actual League Table. Blades are 7th in the XTable, which doesn't allow for the 2-point deduction, but is a realistic reflection of our actual 8th place with the deduction, which would be 5th without the deduction.

Chart 2:
View attachment 192180

So, overall the stats would suggest that our results are a reasonably accurate reflection of our performance and represent a solid playoff position. Teams like Burnley, Oxford and Sunderland are probably significantly overchieving against their performance and might be expected to slip back a bit, whereas teams like Cardiff and Luton are significanlty underachieving against their performance and would be expected to move up the table.

Anyway, let me know if you want me to carry on with this - I'll always keep it separate from the actual match review graphs and charts to prevent the posts getting too big!

UTB & Slava Ukraini - and hoping the Blades get a "Dull" victory on Friday!
Excellent analysis - thank you. It would be great to see this continued through the season.
 
Excellent analysis, and flawed though it is, xG is still a fairly decent predictor of performance. One thing to always remember with xG though, is that it is based on shots, and ignores anything that doesn't result in a shot. The two examples below illustrate this:

1. Team A plays a series of 25 passes, carving open the opposition. The final pass sends Team A's striker through on goal in a 80-20 with the goalkeeper. If the striker gets there first, it's an almost guaranteed goal. However, somehow the goalkeeper manages to get his toe on it first. No shot. xG = 0.

2. Team B have struggled all game. In frustration, one of their midfielders tries a long shot from the halfway line. It goes 30 feet wide to whistles and jeers from the crowd. xG = 0.02.

In those cases, clearly example 1 was a much better 'chance', but it doesn't register on the xG scale, whereas example 2 does. Likewise with cases like last-ditch intercepted passes that stop a goal (xG = 0), bad passes that 9 times out of 10 would have resulted in a goal but didn't because the assister fluffed it up, etc. Nevertheless, xG is probably a better predictor than any other metrics, so it's a worthwhile analysis - thanks!
Yep, xG is definitely an interesting stat to add to the overall performance picture. But you have to understand its limitations. Main consideration is if you have an excellent finisher in your team or an excellent shot stopper then you can expect to consistently and sustainably outperform you xG and that’s still a ‘fair’ reflection of performance (because, well done for having an excellent striker and GK!).

For us, tend to think it’s an accurate reflection on where we’re at right now. I would hope and expect that as the team beds in we’ll be performing top 4 quality not 5-7.

Thanks ucandomagic, I really enjoy this analysis. If you can be bothered to keep it up, am sure it will be appreciated by many on here.
 
Last night at Hull was a really good example of where xG can fall down. We had so many chances, but relatively few shots. Things like Moore being clean through but not pulling the trigger, the occasions where we were millilitres away from intercepting a pass across their six-yard line, the times where one well-placed pass would have seen us 3 on 1. I don’t believe any of those contribute to xG.
 
Last night at Hull was a really good example of where xG can fall down. We had so many chances, but relatively few shots. Things like Moore being clean through but not pulling the trigger, the occasions where we were millilitres away from intercepting a pass across their six-yard line, the times where one well-placed pass would have seen us 3 on 1. I don’t believe any of those contribute to xG.
True but at least it offers a more accurate reflection of the game than the normal shots/ shots on target stats.
 

All advertisments are hidden for logged in members, why not log in/register?

All advertisments are hidden for logged in members, why not log in/register?

Back
Top Bottom