
Stats dont lie part 2 - points gained/lost per player per 90 mins

All advertisments are hidden for logged in members, why not log in/register?

jono_t2000

Well-Known Member
Joined
Aug 8, 2018
Messages
8,025
Reaction score
15,476
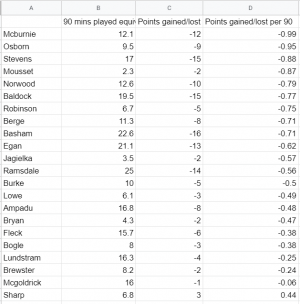
Works on the basis that each game we start off on potentially earning 1 point (so players receive -1 if we lose, 0 if we draw, and 2 if we win)

This is while the player is on the field, so for example if a player comes on in 70th minute and we win the remaining period, that player gets 2 points for winning the period they were on, even if we lose the overall match.
1614207292969.png


Interesting to note that Sharp is the only player who gives us a positive point impact whilst on the field, followed closely by Didsy.

In contrast, Mcburnie costs us the most points per 90 minutes, followed by Stevens, Norwood, Mousset and Osborn
 
Nice work. The results are slightly confounded by the fact that some players might play easier / tougher games than others. For instance, Wilder has admitted that he puts Brewster in for the hardest matches (and yet he comes out reasonably well in your table). I suspect that Sharp sometimes gets the easier games because Wilder expects those to be the ones where we’ll get the ball in the opposition box. Likewise, Burke tends to play when we’re expecting to sit deep and counterattack.
 
Stats sometimes do lie. Sharp comes on at points where we are chasing games. All smaller sample sizes are open to outlying results due to lack of data. How good are the opposition when points are lost and won? What other players were on the pitch at the time?

I love stats but they can be made to say whatever you like
 
Works on the basis that each game we start off on potentially earning 1 point (so players receive -1 if we lose, 0 if we draw, and 2 if we win)

This is while the player is on the field, so for example if a player comes on in 70th minute and we win the remaining period, that player gets 2 points for winning the period they were on, even if we lose the overall match.

View attachment 106405
It would be interesting to see the equivalent stats for last season which may give this a better context.
 
Confirms two things I already knew:

McGoldrick should always be on the pitch, even if one of his legs falls off.

McBurnie should never be on the pitch, because we're crap when he is.
 
It's easy to see why McBurnie is top, we won all three of our games whilst he was injured.

Stats can be brilliant but also very misleading, two of the games we won were at home to Newcastle and WBA who are arguably the two worst sides in the league along with ourselves, especially now Fulham have loaned themselves two thirds of a team.

There's no doubt McBurnie isn't right for us and the style we (try) to play, why would he be when we kick it at his head when he's clearly not a target man and prefers it into feet, but there's no way he is the biggest issue in our team either.
 
Confirms two things I already knew:

McGoldrick should always be on the pitch, even if one of his legs falls off.

McBurnie should never be on the pitch, because we're crap when he is.

Here mate ...

(offers kevlar vest and tin hat)

No one slags McPub off and gets away with it, despite what the stats say.

pommpey


Interesting to note that Sharp is the only player who gives us a positive point impact whilst on the field, followed closely by Didsy.

In contrast, Mcburnie costs us the most points per 90 minutes, followed by Stevens, Norwood, Mousset and Osborn
Has Mousset come on in a game we aren't already losing this season?
 
Totally agree that individual stats, like the one in the OP can distort the reality.

However, When you consider a wider, all encompassing range of stats as key performance indicators, they can at least paint a picture of what the reality is, while never being 100% reflective.

If the sample sizing is large enough, and the KPIs wide ranging in their scope, you really can build accurate pictures.

The data analysis business is perhaps the fastest growing industry globally, and the statophobes would do well to take a step back and take an alternative perspective !!

UTB
 
Totally agree that individual stats, like the one in the OP can distort the reality.

However, When you consider a wider, all encompassing range of stats as key performance indicators, they can at least paint a picture of what the reality is, while never being 100% reflective.

If the sample sizing is large enough, and the KPIs wide ranging in their scope, you really can build accurate pictures.

The data analysis business is perhaps the fastest growing industry globally, and the statophobes would do well to take a step back and take an alternative perspective !!

UTB
Has anyone found a stat yet that supports the selection of Oliver McBurnie?
 
Totally agree that individual stats, like the one in the OP can distort the reality.

However, When you consider a wider, all encompassing range of stats as key performance indicators, they can at least paint a picture of what the reality is, while never being 100% reflective.

If the sample sizing is large enough, and the KPIs wide ranging in their scope, you really can build accurate pictures.

The data analysis business is perhaps the fastest growing industry globally, and the statophobes would do well to take a step back and take an alternative perspective !!

UTB

To be fair, the ‘statophobes’ in this thread are actually saying that the analysis is too simplistic and that extra stats are needed for it to make sense (such as quality of the opposition, full team selections and scenario/status within the game).
 
On the basis of that chart our famous back three should be Ampadu, Jagielka, Bryan, with Lowe at LWB.

I think we can all work out the merits of this approach.

It'll be clear for all to see come 10pm on Sunday night, unless Wilder insists on rolling out Enda Stevens' reanimated corpse at LWB.
 
Last edited:

All advertisments are hidden for logged in members, why not log in/register?

All advertisments are hidden for logged in members, why not log in/register?

Back
Top Bottom