ucandomagic
Well-Known Member
This is my usual review of Blades XG (Expected Goal) performance and general Championship XG stats. The purpose of this is to assess how teams are performing relative to their XG data, as that gives a good indication of their strengths and weaknesses.
So, on Friday 28th March we beat Coventry 3-1 at Bramall Lane.
The footballxg.com data for the game was:
Blades 1.3 – Coventry 1.1
The Blades again beat their stats – this time by scoring some very high tariff goals – The 3 goals that we scored had a total XG of only about 0.5!
Graph 1 shows a comparison of the progress of our actual goals for and against with our XG expected goals for and against over our 39 games so far. XG says that over those 39 games we should have scored 51.7 and conceded 42.6 and we have actually scored 56 and conceded 29. So, we are performing above our XG in scoring but much better than average against our XGA in defence for the chances that we are creating and allowing.
Graph 1:

Our actual goal difference of 27 is much greater than our XG goal difference of 9.1. That difference is mostly due to conceding about 14 less goals than XGA, which has probably gained us at least 20 extra points, without which we would be in 4th place in the actual League Table. Our GoalCooper is directly responsible for saving nearly half of the 14 extra goals that XGA says that we should have conceded. Chart 1 shows the Top Championship Goalkeeper stats.
(A warning sign from Chart 1 is that, in our remaining 7 games, we face all 4 of the Keepers rated Top 5, along with our own SuperCooperKeeper!)
Chart 1:

Putting us into context with other teams, we now have the 8th best XG total but the 3rd best XGA total, behind only Leeds and Burnley. The fact that we have a good XGA, and we are still significantly outperforming even that is the major reason for our current league position. (Burnley are even more extreme - amazingly being 12th in XG and 2nd in XGA!)
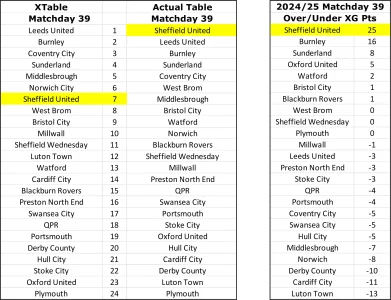
Chart 2 is the XTable - based on both team’s XG’s in matches played – alongside the actual League Table. Blades are 7th in the XTable and Top in the actual League table, so our actual results are much better than our XG stats would imply. As discussed above, our outperformance is driven by having only conceded 29 goals against an XGA of 42.6.
Chart 2 also shows over and underperformance of actual points against XG points. Blades and Burnley dominate this table – Blades with an amazing 25 points more than XG points would imply, and Burnley with 16 more points. This overperformance is the result of overperforming an already low XGA. XGA is measured when a shot is actually taken – so preventing shots provides a low XGA - the secret of this level of gaining points is then to outperform significantly against that already good XGA.
Luton are at the other end of the spectrum – significantly underperforming their XG points – this is largely because they have scored 13 goals less than their XG stats!
Chart 2:

If we get promoted our defence has to continue to be excellent, as it was in 2019/20.
Plan A for the Summer Window has to be “Sign Souttar”!
Our next game is on Saturday April 5th against Oxford at the Kassam.
Oxford have scored 27 goals in their 19 home games with an XG of 19.8 and conceded 25 with an XGA of 24.8. Blades have scored 26 in 20 away games with an XG of 22.6 and conceded 14 with an XGA of 22.9.
So the stats would suggest that the Blades will score at least 1 and Oxford will score at most 1 – so 1-0 Blades, 1-1, 2-1 Blades, 2-0 Blades are probably the most likely results, in that order.
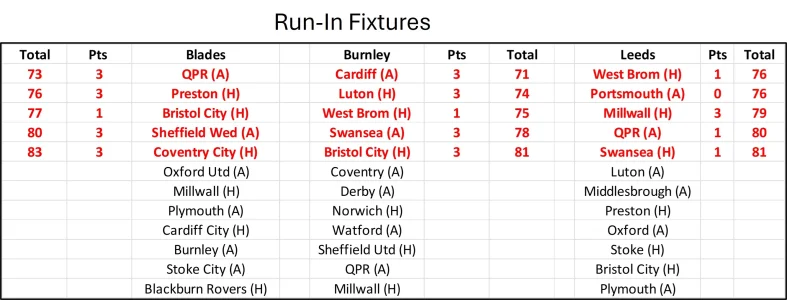
7 to go – the Run-In has Started.
Let’s hope for a Coventry rebound against Burnley and a continuation of the Luton revival at Leeds.

For the number nerds, I’ve attached the complete footballxg.com XTable below. (Remember that this doesn’t include our 2-point deduction.)
UTB & Slava Ukraini!
Footballxg.xom Table:

So, on Friday 28th March we beat Coventry 3-1 at Bramall Lane.
The footballxg.com data for the game was:
Blades 1.3 – Coventry 1.1
The Blades again beat their stats – this time by scoring some very high tariff goals – The 3 goals that we scored had a total XG of only about 0.5!
Graph 1 shows a comparison of the progress of our actual goals for and against with our XG expected goals for and against over our 39 games so far. XG says that over those 39 games we should have scored 51.7 and conceded 42.6 and we have actually scored 56 and conceded 29. So, we are performing above our XG in scoring but much better than average against our XGA in defence for the chances that we are creating and allowing.
Graph 1:

Our actual goal difference of 27 is much greater than our XG goal difference of 9.1. That difference is mostly due to conceding about 14 less goals than XGA, which has probably gained us at least 20 extra points, without which we would be in 4th place in the actual League Table. Our GoalCooper is directly responsible for saving nearly half of the 14 extra goals that XGA says that we should have conceded. Chart 1 shows the Top Championship Goalkeeper stats.
(A warning sign from Chart 1 is that, in our remaining 7 games, we face all 4 of the Keepers rated Top 5, along with our own SuperCooperKeeper!)
Chart 1:

Putting us into context with other teams, we now have the 8th best XG total but the 3rd best XGA total, behind only Leeds and Burnley. The fact that we have a good XGA, and we are still significantly outperforming even that is the major reason for our current league position. (Burnley are even more extreme - amazingly being 12th in XG and 2nd in XGA!)
Chart 2 is the XTable - based on both team’s XG’s in matches played – alongside the actual League Table. Blades are 7th in the XTable and Top in the actual League table, so our actual results are much better than our XG stats would imply. As discussed above, our outperformance is driven by having only conceded 29 goals against an XGA of 42.6.
Chart 2 also shows over and underperformance of actual points against XG points. Blades and Burnley dominate this table – Blades with an amazing 25 points more than XG points would imply, and Burnley with 16 more points. This overperformance is the result of overperforming an already low XGA. XGA is measured when a shot is actually taken – so preventing shots provides a low XGA - the secret of this level of gaining points is then to outperform significantly against that already good XGA.
Luton are at the other end of the spectrum – significantly underperforming their XG points – this is largely because they have scored 13 goals less than their XG stats!
Chart 2:

If we get promoted our defence has to continue to be excellent, as it was in 2019/20.
Plan A for the Summer Window has to be “Sign Souttar”!
Our next game is on Saturday April 5th against Oxford at the Kassam.
Oxford have scored 27 goals in their 19 home games with an XG of 19.8 and conceded 25 with an XGA of 24.8. Blades have scored 26 in 20 away games with an XG of 22.6 and conceded 14 with an XGA of 22.9.
So the stats would suggest that the Blades will score at least 1 and Oxford will score at most 1 – so 1-0 Blades, 1-1, 2-1 Blades, 2-0 Blades are probably the most likely results, in that order.
7 to go – the Run-In has Started.
Let’s hope for a Coventry rebound against Burnley and a continuation of the Luton revival at Leeds.

For the number nerds, I’ve attached the complete footballxg.com XTable below. (Remember that this doesn’t include our 2-point deduction.)
UTB & Slava Ukraini!
Footballxg.xom Table:

