ucandomagic
Well-Known Member
It has been a hectic high-pressure season right from Matchday 1, and we now have the last international break to regroup and review before the final lap of 8 crucial matches This is my review of Blades XG (Expected Goal) performance and general Championship XG stats. The purpose of this is to assess how teams are performing relative to their XG data, as that gives a good indication of their strengths and weaknesses and future results.
So, on Sunday 6th March we beat Wendy 1-0 at Hillsborough.
The XG data for the game was Wendy 1.3 – Blades 1.3
So, once again, the stats reflected the really tight game that we saw on the pitch. Once again, the Blades managed to come out on top in a game which could have gone either way. So is there a reason that the Blades are regularly battling through in tight games?
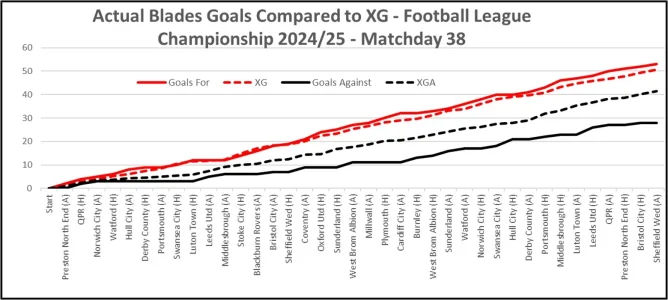
Graph 1 shows a comparison of the progress of our actual goals for and against with our XG expected goals for and against over our 38 games so far. XG says that over those 38 games we should have scored 50.7 and conceded 41.4 and we have actually scored 53 and conceded 28. So, we are performing slightly above our XG in scoring but much better than average against our XGA in defence for the chances that we are creating and allowing.
Graph 1:

Our actual goal difference of 25 is much greater than our XG goal difference of 9. That difference is mostly due to conceding about 13 less goals than XGA, which has probably gained us at least 15 extra points, without which we would be in 4th place or worse in the actual League Table. Our GoalCooper is directly responsible for saving nearly half of the 13 extra goals that XGA says that we should have conceded. Chart 1 shows the Top Championship Goalkeeper Goals Prevented stats.
Chart 1:

Putting us into context with other teams, we now have the 8th best XG total but the 3rd best XGA total, behind only Leeds and Burnley. The fact that we have a good XGA, and we are still significantly outperforming even that is the major reason for our current league position. (Burnley are even more extreme - amazingly being 12th in XG and 2nd in XGA!)
Chart 2 is the XTable - based on both team’s XG’s in matches played – alongside the actual League Table. Blades are 7th in the XTable and 2nd in the actual League table, so our actual results are much better than our XG stats would imply. As discussed above, our outperformance is driven by having only conceded 28 goals against an XGA of 41.4.
Watford are the biggest overperformers here – being 10th in the actual table but 17th in the XTable. Luton, on the other hand are 10 places below where their performance would expect.
Chart 2:

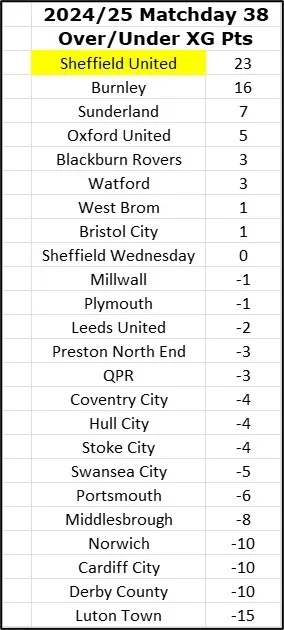
The significance of performance-beating statistics is blindingly obvious in Chart 3, which shows over and underperformance of actual points against XG points. Most teams have points relatively close to their expected value – Leeds are the best team, they have the best stats in every measurement and their actual points are a couple below their expected points. However, Blades have a staggering 23 points more than expected and Burnley have 16.
Chart 3:

Blades and Burnley both have Top 3 XGA stats – but Leeds have the best XGA and yet are actually behind their expected points. Blades’ and Burnley’s success is obviously based on keeping opposition chances down (XGA), but the secret sauce is then to outperform significantly against that already good XGA. XGA is measured when a shot is actually taken – so preventing shots provides a low XGA. To then beat XGA by this amount, as shown above in Chart 1, you obviously need a top class Keeper, but then the opposition must be kept under really tight pressure with shots blocked or taken under such pressure that their probability of success is significantly affected.
If we get promoted our defence has to be excellent for us to have any chance of staying up. In 2019/20 we scored 39 and conceded 39 Premier League goals and finished 9th – last season we scored 35 but conceded 104! People talked about overlapping centre-backs, but our success in 2019/20 actually came from them just being bloody good centre-backs. We do have the basis of a good defence now, but it was significantly better when we had the colossus that is Souttar in the side. I believe that, if we get promoted, signing Souttar would give us a real chance to stay up.
Our next game is next Friday night (28th) against Coventry at Bramall Lane.
Coventry have scored 21 goals in their 19 away games with an XG of 26.6 and conceded 26 with an XGA of 23.4. Blades have scored 27 in 19 home games with an XG of 27.8 and conceded 14 with an XGA of 18.6.
So the stats would probably suggest 1-0 Blades with 1-1 being the next most likely result.
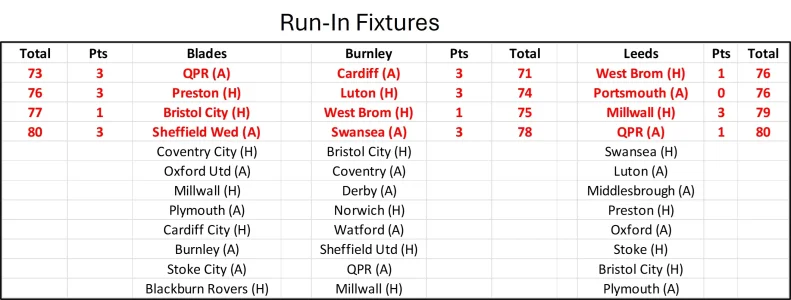
8 to go – April 21st at Turf Moor could effectively be a promotion final but I think that, as long as we don’t lose that, we will be OK.
Fill in your own numbers below to see what you think.
UTB & Slava Ukraini!

So, on Sunday 6th March we beat Wendy 1-0 at Hillsborough.
The XG data for the game was Wendy 1.3 – Blades 1.3
So, once again, the stats reflected the really tight game that we saw on the pitch. Once again, the Blades managed to come out on top in a game which could have gone either way. So is there a reason that the Blades are regularly battling through in tight games?
Graph 1 shows a comparison of the progress of our actual goals for and against with our XG expected goals for and against over our 38 games so far. XG says that over those 38 games we should have scored 50.7 and conceded 41.4 and we have actually scored 53 and conceded 28. So, we are performing slightly above our XG in scoring but much better than average against our XGA in defence for the chances that we are creating and allowing.
Graph 1:

Our actual goal difference of 25 is much greater than our XG goal difference of 9. That difference is mostly due to conceding about 13 less goals than XGA, which has probably gained us at least 15 extra points, without which we would be in 4th place or worse in the actual League Table. Our GoalCooper is directly responsible for saving nearly half of the 13 extra goals that XGA says that we should have conceded. Chart 1 shows the Top Championship Goalkeeper Goals Prevented stats.
Chart 1:

Putting us into context with other teams, we now have the 8th best XG total but the 3rd best XGA total, behind only Leeds and Burnley. The fact that we have a good XGA, and we are still significantly outperforming even that is the major reason for our current league position. (Burnley are even more extreme - amazingly being 12th in XG and 2nd in XGA!)
Chart 2 is the XTable - based on both team’s XG’s in matches played – alongside the actual League Table. Blades are 7th in the XTable and 2nd in the actual League table, so our actual results are much better than our XG stats would imply. As discussed above, our outperformance is driven by having only conceded 28 goals against an XGA of 41.4.
Watford are the biggest overperformers here – being 10th in the actual table but 17th in the XTable. Luton, on the other hand are 10 places below where their performance would expect.
Chart 2:

The significance of performance-beating statistics is blindingly obvious in Chart 3, which shows over and underperformance of actual points against XG points. Most teams have points relatively close to their expected value – Leeds are the best team, they have the best stats in every measurement and their actual points are a couple below their expected points. However, Blades have a staggering 23 points more than expected and Burnley have 16.
Chart 3:

Blades and Burnley both have Top 3 XGA stats – but Leeds have the best XGA and yet are actually behind their expected points. Blades’ and Burnley’s success is obviously based on keeping opposition chances down (XGA), but the secret sauce is then to outperform significantly against that already good XGA. XGA is measured when a shot is actually taken – so preventing shots provides a low XGA. To then beat XGA by this amount, as shown above in Chart 1, you obviously need a top class Keeper, but then the opposition must be kept under really tight pressure with shots blocked or taken under such pressure that their probability of success is significantly affected.
If we get promoted our defence has to be excellent for us to have any chance of staying up. In 2019/20 we scored 39 and conceded 39 Premier League goals and finished 9th – last season we scored 35 but conceded 104! People talked about overlapping centre-backs, but our success in 2019/20 actually came from them just being bloody good centre-backs. We do have the basis of a good defence now, but it was significantly better when we had the colossus that is Souttar in the side. I believe that, if we get promoted, signing Souttar would give us a real chance to stay up.
Our next game is next Friday night (28th) against Coventry at Bramall Lane.
Coventry have scored 21 goals in their 19 away games with an XG of 26.6 and conceded 26 with an XGA of 23.4. Blades have scored 27 in 19 home games with an XG of 27.8 and conceded 14 with an XGA of 18.6.
So the stats would probably suggest 1-0 Blades with 1-1 being the next most likely result.
8 to go – April 21st at Turf Moor could effectively be a promotion final but I think that, as long as we don’t lose that, we will be OK.
Fill in your own numbers below to see what you think.
UTB & Slava Ukraini!

