ucandomagic
Well-Known Member
My lad asked me after the game – “How do you feel about that?” I said “I feel really disappointed – but I’m really delighted that I feel disappointed”! A point away at Villa, with 15 successive wins at Villa Park I think, was realistically probably the most that we could have hoped for. Obviously conceding a 97th minute equaliser is gutting, but with 2 shots on target and 3 VAR decisions going our way I’ll take a point every day of the week. My biggest take on individual performances this week was Brooks’ display off the ball, which I thought was fantastic.
This week, I’ll try to use some graphs that bring out Wilder’s impact as much as I can. First of all though, Graph 1 is the usual plot that compares our progress against our last 2 Prem seasons and against my benchmark results to achieve survival. In the 20-team Prem League history 35 points would have kept you up in 50% of the seasons – so my main survival line is a set of results to get 35 points. I’ve included a highest (43) and lowest (29) set of results to show the spread that has been possible for survival over the 28 seasons.
The line for this season is now 3 points below the minimum possible survival line and 6 points behind the 50% survival chance line. We’re 4 points clear of Wilder’s 20/21 season.
Graph 1:

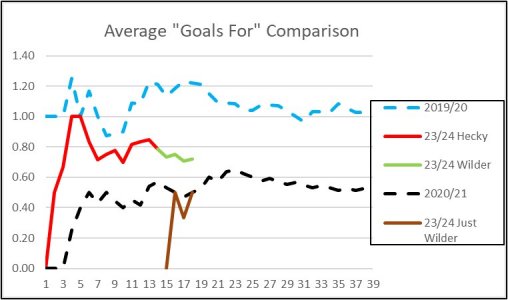
In Graphs 2 and 3, I’ve plotted our average goals for and against over this season, along with our last 2 Premier League seasons, in order to try and see where the manager change has made a difference, and how significant that difference might be. In our great 2019/20 season we scored 39 goals and conceded 39 goals – so for us I think a good target average would probably be one goal for and one goal against.
Graph 2 shows that our overall Average Goals For under Hecky was about 0.8 and has reduced slightly to about 0.75 now. The brown line is the average for just Wilder’s games, with an average of 0.5 but, as that is from 2 games against top 4 teams and all games against top 11 teams, that is OK.
Graph 2:

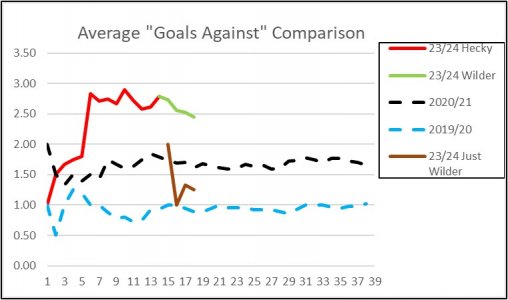
Graph 3 is where Wilder’s impact really shows. Our Overall Average Goals Against has happily come down from about 2.8 in Hecky’s period to about 2.4 now. When you look at the brown line though, for just Wilder’s period, you can see that average goals against is down at 1.25 – not far above the 1.03 that we achieved in 2019/20. So against 4 quality sides Wilder has got our defence back close to the level of our top half season in 2019/20. For me, that is the crucial takeaway so far – he has turned a dire defensive record into one very close to the record that took us to 9th place. It is keeping Wilder’s average goals against column close to one that will give us a chance to stay up.
Graph 3:

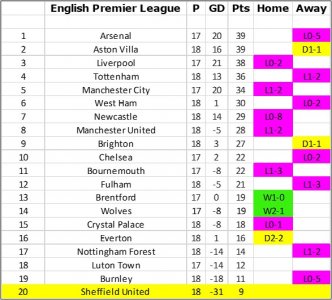
Finally, a very disappointing League Table (before Liverpool v Arsenal) with Luton and Burnley winning, but at least Forest got a 94th minute kick in the crotch, so we are now just 5 points behind 17th place. That bit of yellow near to the top looks good though!
League Table:

The Luton game is even more important now, so let’s hope we can sing about this year’s Boxing Day!
Happy Christmas
UTB & Slava Ukraini
This week, I’ll try to use some graphs that bring out Wilder’s impact as much as I can. First of all though, Graph 1 is the usual plot that compares our progress against our last 2 Prem seasons and against my benchmark results to achieve survival. In the 20-team Prem League history 35 points would have kept you up in 50% of the seasons – so my main survival line is a set of results to get 35 points. I’ve included a highest (43) and lowest (29) set of results to show the spread that has been possible for survival over the 28 seasons.
The line for this season is now 3 points below the minimum possible survival line and 6 points behind the 50% survival chance line. We’re 4 points clear of Wilder’s 20/21 season.
Graph 1:

In Graphs 2 and 3, I’ve plotted our average goals for and against over this season, along with our last 2 Premier League seasons, in order to try and see where the manager change has made a difference, and how significant that difference might be. In our great 2019/20 season we scored 39 goals and conceded 39 goals – so for us I think a good target average would probably be one goal for and one goal against.
Graph 2 shows that our overall Average Goals For under Hecky was about 0.8 and has reduced slightly to about 0.75 now. The brown line is the average for just Wilder’s games, with an average of 0.5 but, as that is from 2 games against top 4 teams and all games against top 11 teams, that is OK.
Graph 2:

Graph 3 is where Wilder’s impact really shows. Our Overall Average Goals Against has happily come down from about 2.8 in Hecky’s period to about 2.4 now. When you look at the brown line though, for just Wilder’s period, you can see that average goals against is down at 1.25 – not far above the 1.03 that we achieved in 2019/20. So against 4 quality sides Wilder has got our defence back close to the level of our top half season in 2019/20. For me, that is the crucial takeaway so far – he has turned a dire defensive record into one very close to the record that took us to 9th place. It is keeping Wilder’s average goals against column close to one that will give us a chance to stay up.
Graph 3:

Finally, a very disappointing League Table (before Liverpool v Arsenal) with Luton and Burnley winning, but at least Forest got a 94th minute kick in the crotch, so we are now just 5 points behind 17th place. That bit of yellow near to the top looks good though!
League Table:

The Luton game is even more important now, so let’s hope we can sing about this year’s Boxing Day!
Happy Christmas
UTB & Slava Ukraini
