Blades Mackem Pay - Matchday 18 Graphs, XG-raphs, Charts, Chat & West Brom Forecast

All advertisments are hidden for logged in members, why not log in/register?

ucandomagic

Well-Known Member
Joined
Dec 16, 2013
Messages
2,514
Reaction score
10,529
Location
Studley
The Sunlan match was a great game to watch. They came to win, and we had a tense open game. They were better than us first half and probably our equal after the break, but they definitely faded towards the end. That wasn’t surprising – all their goals in November have been scored in the first 35 minutes, and against Coventry and Millwall they were ahead but conceded equalisers in the 84th and 93rd minutes.

The ref got all the big decisions right – so he didn’t affect the outcome. Pivotal moments, apart from the goal, were obviously GoalCooper’s penalty save and the 2 red cards. I thought we played well all over the pitch, although I don’t think JRS is as effective when the match is quite physical – getting knocked off the ball quite easily. Tom Davies getting the goal was just fantastic – as he is such a gritty bloke in the way he plays as well as the way that he has handled his injuries. Finally, as I put in a post after the match, I think that Seriki changed the whole momentum of the game, and through that the result, when he came on.

So, on to the graphs

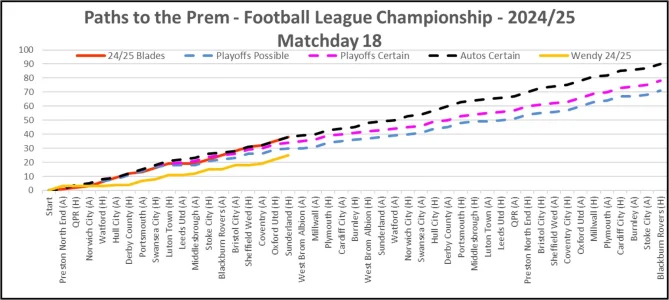
Graph 1 compares our progress against 3 benchmark sets of results which represent Automatic Promotion, Playoff Certainty and Playoff Possibility. My benchmarks take account of who our opponents are each week. On 38 points, comparing to my benchmarks, we are still bang on my Autos Promotion schedule – and without the deduction we would be 2 points ahead – this schedule has a draw against the Baggies next Sunday.

Graph 1
:
24-25 Paths To The Prem Matchday 18.webp


Graph 2
compares this season against our last 3 successful promotions from this level (all in second place), in 2005/06, 2018/19 and 2022/23. On 38 points after 18 games (with the 2-point deduction) we are 7 points ahead of the 31 points that we had under Wilder in 18/19, 6 ahead of Hecky in 22/23 and 6 points behind Warnock in 05/06.

So this is still our best Championship start since 2005, and is significantly better than our last 2 promotion seasons – and that includes that deduction!

Graph 2:
24-25 Compared to Earlier Seasons Matchday 18.webp


Next, the coloured annotated up-to-date League Table, which highlights where our strengths and weaknesses are against opponents’ league positions. Blades are now loud and proud at the top of the pile. As everybody expected, Leeds, Burnley and Boro are our biggest threats – Sunderland have started to fall away, as would probably be expected from such a young side.

League Table:
24-25 League Table Matchday 18.webp


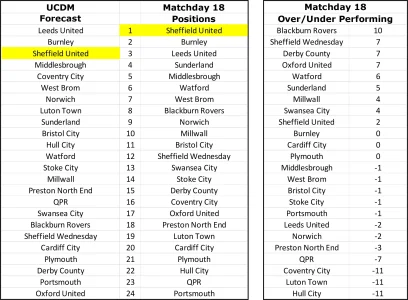
Before the start of the season, I posted my predicted league positions for the end of the season and Chart 1 reviews each team’s current position relative to my end of season forecast position.

Chart 1:
Over - Under Matchday 18.webp


The big overperformers compared to my forecast are Blackburn and Wendy and the biggest underperformers compared to my forecast are Hull, Luton and Coventry. So I am expecting Blackburn and Wendy to slip down the table as the season progresses. (However, I’m very happy that Blackburn outperformed my expectations on Saturday and removed a few “Dirty Weeds”!) Similarly, I’m expecting Hull, Luton and Coventry to work their way up the table over the coming weeks.


Moving on to XG data (for the more nerdy amongst us!) - this is my review of Blades XG performance and general Championship XG stats. The purpose of this is simply to assess how teams are performing relative to their XG data – ie if a team’s results are better than their XG data it would suggest that they are overperforming and likely to slip back – and vice versa.

On Friday November 26th we beat Sunderland 1-0 at Bramall Lane.

The XG data for the game was Blades 0.8 – Sunderland 2.0. (
This emphasises that our defence is why we are doing so well. On average the chances created in the game suggest we should have lost 2-1, and yet we won 1-0.)

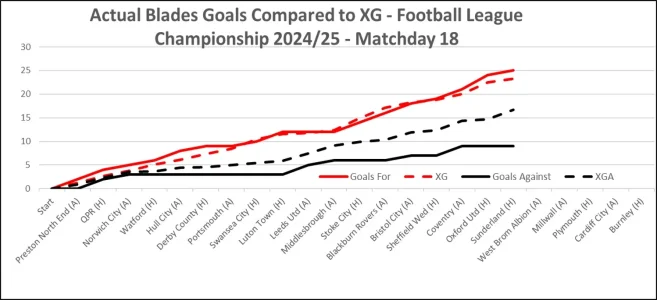
Graph 3 shows a comparison of the progress of our actual goals for and against with our XG expected goals for and against over our 18 games so far. XG says that over those 18 games we should have scored 23.3 and conceded 16.7 and we have actually scored 25 and conceded 9. So, we are performing above our XG in scoring and much better than average against our XGA in defence for the chances that we are creating and allowing. Putting that into context with other teams, we have the 8th highest XG total and the 5th lowest XGA total.

However, the fact that we have a good XGA, and yet we are significantly out performing even that, is the major reason for our current successful position.

Graph 3:
XG Comparison - Matchday 18.webp


Chart 2
is the XTable - based on both team’s XG’s in matches played – alongside the actual League Table. Blades are 4th in the XTable and 1st in the actual League table, so our actual results are better than our XG stats would imply. This outperformance is actually even greater, because the XTable does not apply the 2-point deduction. If the deduction were applied we would only be 8th in the XTable. As discussed above, our outperformance is driven by having only conceded 9 goals against an XGA of 16.7.

Blackburn are the biggest overperformers here – being 8th in the actual table but 19th in the XTable. Coventry are the exact opposite, being 16th in the actual table but 5th in the XTable. I think that it is interesting that the big over/under performers compared to the XTable in Chart 2 are very similar to those compared to my end-of-season forecast in Chart 1.

Chart 2:
Over- Under XTable Matchday 18.webp


So, overall the stats show that our actual results are better than our XG performance and represent a certain playoff/likely automatics position. As mentioned, we are 8th best in XG, but we are 5th best in XGA, behind only Burnley, Leeds, Millwall and Middlesbrough. Our average XGA of 0.93 goals per game is a fairly good figure, but we are significantly outperforming that by delivering an actual average of only 0.5 goals against per game, a figure only beaten by Burnley. It is the outperformance of our XGA which leads to our outperforming our XG league position.


Teams like Blackburn, Watford, Wendy, and Oxford are overachieving significantly against their performance and might be expected to slip down the table. Conversely, teams like Coventry, Luton and QPR are significantly underachieving against their performance and would be expected to move up the table.

Our next game is on November 23rd away at West Brom. They have scored just 4 goals in their 8 home games with an XG of 11.5 and conceded 3 with an XGA of 7.6. So the actual stats would certainly suggest 0-0 and the XG stats probably 1-1. However, I will forecast a 1-0 Blades win, with 0-0 and 1-1 as the next 2 most likely results.

So that’s it for another excellent week. Apologies if you don’t enjoy the XG stuff – I may separate it into a separate post next week (as this post has probably got a bit too much content!)

UTB & Slava Ukraini!
 
Last edited:

Good stuff Mr magic.
Our over performance again st the xga stat is worrying and likely unsustainable. We're giving up too many chances and if that continues, sooner or later goals against will happen. We can't rely on Cooperman getting us out of the sh1t so often.
I see you've put the pigs back on the first graph. Not sure we want reminding they're doing quite well.
 
The Sunlan match was a great game to watch. They came to win, and we had a tense open game. They were better than us first half and probably our equal after the break, but they definitely faded towards the end. That wasn’t surprising – all their goals in November have been scored in the first 35 minutes, and against Coventry and Millwall they were ahead but conceded equalisers in the 84th and 93rd minutes.

The ref got all the big decisions right – so he didn’t affect the outcome. Pivotal moments, apart from the goal, were obviously GoalCooper’s penalty save and the 2 red cards. I thought we played well all over the pitch, although I don’t think JRS is as effective when the match is quite physical – getting knocked off the ball quite easily. Tom Davies getting the goal was just fantastic – as he is such a gritty bloke in the way he plays as well as the way that he has handled his injuries. Finally, as I put in a post after the match, I think that Seriki changed the whole momentum of the game, and through that the result, when he came on.

So, on to the graphs

Graph 1 compares our progress against 3 benchmark sets of results which represent Automatic Promotion, Playoff Certainty and Playoff Possibility. My benchmarks take account of who our opponents are each week. On 38 points, comparing to my benchmarks, we are still bang on my Autos Promotion schedule – and without the deduction we would be 2 points ahead – this schedule has a draw against the Baggies next Sunday.

Graph 1
:
View attachment 198542


Graph 2
compares this season against our last 3 successful promotions from this level (all in second place), in 2005/06, 2018/19 and 2022/23. On 38 points after 18 games (with the 2-point deduction) we are 7 points ahead of the 31 points that we had under Wilder in 18/19, 6 ahead of Hecky in 22/23 and 6 points behind Warnock in 05/06.

So this is still our best Championship start since 2005, and is significantly better than our last 2 promotion seasons – and that includes that deduction!

Graph 2:
View attachment 198543


Next, the coloured annotated up-to-date League Table, which highlights where our strengths and weaknesses are against opponents’ league positions. Blades are now loud and proud at the top of the pile. As everybody expected, Leeds, Burnley and Boro are our biggest threats – Sunderland have started to fall away, as would probably be expected from such a young side.

League Table:
View attachment 198544


Before the start of the season, I posted my predicted league positions for the end of the season and Chart 1 reviews each team’s current position relative to my end of season forecast position.

Chart 1:
View attachment 198545


The big overperformers compared to my forecast are Blackburn and Wendy and the biggest underperformers compared to my forecast are Hull, Luton and Coventry. So I am expecting Blackburn and Wendy to slip down the table as the season progresses. (However, I’m very happy that Blackburn outperformed my expectations on Saturday and removed a few “Dirty Weeds”!) Similarly, I’m expecting Hull, Luton and Coventry to work their way up the table over the coming weeks.


Moving on to XG data (for the more nerdy amongst us!) - this is my review of Blades XG performance and general Championship XG stats. The purpose of this is simply to assess how teams are performing relative to their XG data – ie if a team’s results are better than their XG data it would suggest that they are overperforming and likely to slip back – and vice versa.

On Friday November 26th we beat Sunderland 1-0 at Bramall Lane.

The XG data for the game was Blades 0.8 – Sunderland 2.0. (
This emphasises that our defence is why we are doing so well. On average the chances created in the game suggest we should have lost 2-1, and yet we won 1-0.)

Graph 3 shows a comparison of the progress of our actual goals for and against with our XG expected goals for and against over our 18 games so far. XG says that over those 18 games we should have scored 23.3 and conceded 16.7 and we have actually scored 25 and conceded 9. So, we are performing above our XG in scoring and much better than average against our XGA in defence for the chances that we are creating and allowing. Putting that into context with other teams, we have the 8th highest XG total and the 5th lowest XGA total.

However, the fact that we have a good XGA, and yet we are significantly out performing even that, is the major reason for our current successful position.

Graph 3:
View attachment 198546


Chart 2
is the XTable - based on both team’s XG’s in matches played – alongside the actual League Table. Blades are 4th in the XTable and 1st in the actual League table, so our actual results are better than our XG stats would imply. This outperformance is actually even greater, because the XTable does not apply the 2-point deduction. If the deduction were applied we would only be 8th in the XTable. As discussed above, our outperformance is driven by having only conceded 9 goals against an XGA of 16.7.

Blackburn are the biggest overperformers here – being 8th in the actual table but 19th in the XTable. Coventry are the exact opposite, being 16th in the actual table but 5th in the XTable. I think that it is interesting that the big over/under performers compared to the XTable in Chart 2 are very similar to those compared to my end-of-season forecast in Chart 1.

Chart 2:
View attachment 198547


So, overall the stats show that our actual results are better than our XG performance and represent a certain playoff/likely automatics position. As mentioned, we are 8th best in XG, but we are 5th best in XGA, behind only Burnley, Leeds, Millwall and Middlesbrough. Our average XGA of 0.93 goals per game is a fairly good figure, but we are significantly outperforming that by delivering an actual average of only 0.5 goals against per game, a figure only beaten by Burnley. It is the outperformance of our XGA which leads to our outperforming our XG league position.


Teams like Blackburn, Watford, Wendy, and Oxford are overachieving significantly against their performance and might be expected to slip down the table. Conversely, teams like Coventry, Luton and QPR are significantly underachieving against their performance and would be expected to move up the table.

Our next game is on November 23rd away at West Brom. They have scored just 4 goals in their 8 home games with an XG of 11.5 and conceded 3 with an XGA of 7.6. So the actual stats would certainly suggest 0-0 and the XG stats probably 1-1. However, I will forecast a 1-0 Blades win, with 0-0 and 1-1 as the next 2 most likely results.

So that’s it for another excellent week. Apologies if you don’t enjoy the XG stuff – I may separate it into a separate post next week (as this post has probably got a bit too much content!)

UTB & Slava Ukraini!

Thanks for that ucandomagic ❤️

Probably worth mentioning that Sunderlands xG includes around 0.7 from the penalty.

Through general open play the xG's were actually alot closer
 
The Sunlan match was a great game to watch. They came to win, and we had a tense open game. They were better than us first half and probably our equal after the break, but they definitely faded towards the end. That wasn’t surprising – all their goals in November have been scored in the first 35 minutes, and against Coventry and Millwall they were ahead but conceded equalisers in the 84th and 93rd minutes.

The ref got all the big decisions right – so he didn’t affect the outcome. Pivotal moments, apart from the goal, were obviously GoalCooper’s penalty save and the 2 red cards. I thought we played well all over the pitch, although I don’t think JRS is as effective when the match is quite physical – getting knocked off the ball quite easily. Tom Davies getting the goal was just fantastic – as he is such a gritty bloke in the way he plays as well as the way that he has handled his injuries. Finally, as I put in a post after the match, I think that Seriki changed the whole momentum of the game, and through that the result, when he came on.

So, on to the graphs

Graph 1 compares our progress against 3 benchmark sets of results which represent Automatic Promotion, Playoff Certainty and Playoff Possibility. My benchmarks take account of who our opponents are each week. On 38 points, comparing to my benchmarks, we are still bang on my Autos Promotion schedule – and without the deduction we would be 2 points ahead – this schedule has a draw against the Baggies next Sunday.

Graph 1
:
View attachment 198542


Graph 2
compares this season against our last 3 successful promotions from this level (all in second place), in 2005/06, 2018/19 and 2022/23. On 38 points after 18 games (with the 2-point deduction) we are 7 points ahead of the 31 points that we had under Wilder in 18/19, 6 ahead of Hecky in 22/23 and 6 points behind Warnock in 05/06.

So this is still our best Championship start since 2005, and is significantly better than our last 2 promotion seasons – and that includes that deduction!

Graph 2:
View attachment 198543


Next, the coloured annotated up-to-date League Table, which highlights where our strengths and weaknesses are against opponents’ league positions. Blades are now loud and proud at the top of the pile. As everybody expected, Leeds, Burnley and Boro are our biggest threats – Sunderland have started to fall away, as would probably be expected from such a young side.

League Table:
View attachment 198544


Before the start of the season, I posted my predicted league positions for the end of the season and Chart 1 reviews each team’s current position relative to my end of season forecast position.

Chart 1:
View attachment 198545


The big overperformers compared to my forecast are Blackburn and Wendy and the biggest underperformers compared to my forecast are Hull, Luton and Coventry. So I am expecting Blackburn and Wendy to slip down the table as the season progresses. (However, I’m very happy that Blackburn outperformed my expectations on Saturday and removed a few “Dirty Weeds”!) Similarly, I’m expecting Hull, Luton and Coventry to work their way up the table over the coming weeks.


Moving on to XG data (for the more nerdy amongst us!) - this is my review of Blades XG performance and general Championship XG stats. The purpose of this is simply to assess how teams are performing relative to their XG data – ie if a team’s results are better than their XG data it would suggest that they are overperforming and likely to slip back – and vice versa.

On Friday November 26th we beat Sunderland 1-0 at Bramall Lane.

The XG data for the game was Blades 0.8 – Sunderland 2.0. (
This emphasises that our defence is why we are doing so well. On average the chances created in the game suggest we should have lost 2-1, and yet we won 1-0.)

Graph 3 shows a comparison of the progress of our actual goals for and against with our XG expected goals for and against over our 18 games so far. XG says that over those 18 games we should have scored 23.3 and conceded 16.7 and we have actually scored 25 and conceded 9. So, we are performing above our XG in scoring and much better than average against our XGA in defence for the chances that we are creating and allowing. Putting that into context with other teams, we have the 8th highest XG total and the 5th lowest XGA total.

However, the fact that we have a good XGA, and yet we are significantly out performing even that, is the major reason for our current successful position.

Graph 3:
View attachment 198546


Chart 2
is the XTable - based on both team’s XG’s in matches played – alongside the actual League Table. Blades are 4th in the XTable and 1st in the actual League table, so our actual results are better than our XG stats would imply. This outperformance is actually even greater, because the XTable does not apply the 2-point deduction. If the deduction were applied we would only be 8th in the XTable. As discussed above, our outperformance is driven by having only conceded 9 goals against an XGA of 16.7.

Blackburn are the biggest overperformers here – being 8th in the actual table but 19th in the XTable. Coventry are the exact opposite, being 16th in the actual table but 5th in the XTable. I think that it is interesting that the big over/under performers compared to the XTable in Chart 2 are very similar to those compared to my end-of-season forecast in Chart 1.

Chart 2:
View attachment 198547


So, overall the stats show that our actual results are better than our XG performance and represent a certain playoff/likely automatics position. As mentioned, we are 8th best in XG, but we are 5th best in XGA, behind only Burnley, Leeds, Millwall and Middlesbrough. Our average XGA of 0.93 goals per game is a fairly good figure, but we are significantly outperforming that by delivering an actual average of only 0.5 goals against per game, a figure only beaten by Burnley. It is the outperformance of our XGA which leads to our outperforming our XG league position.


Teams like Blackburn, Watford, Wendy, and Oxford are overachieving significantly against their performance and might be expected to slip down the table. Conversely, teams like Coventry, Luton and QPR are significantly underachieving against their performance and would be expected to move up the table.

Our next game is on November 23rd away at West Brom. They have scored just 4 goals in their 8 home games with an XG of 11.5 and conceded 3 with an XGA of 7.6. So the actual stats would certainly suggest 0-0 and the XG stats probably 1-1. However, I will forecast a 1-0 Blades win, with 0-0 and 1-1 as the next 2 most likely results.

So that’s it for another excellent week. Apologies if you don’t enjoy the XG stuff – I may separate it into a separate post next week (as this post has probably got a bit too much content!)

UTB & Slava Ukraini!
Great post. They flow quite well as one post.
The yellow worm is coming for us !!!!!!
 
Thanks for that ucandomagic ❤️

Probably worth mentioning that Sunderlands xG includes around 0.7 from the penalty.

Through general open play the xG's were actually alot closer

I was going to ask what the xG for the penalty was because although Sunderland had some decent play, it felt like their chances were only really half chances.

It was a close game in terms of chances in my opinion.
 
Graph 3 shows a comparison of the progress of our actual goals for and against with our XG expected goals for and against over our 18 games so far. XG says that over those 18 games we should have scored 23.3 and conceded 16.7 and we have actually scored 25 and conceded 9. So, we are performing above our XG in scoring and much better than average against our XGA in defence for the chances that we are creating and allowing. Putting that into context with other teams, we have the 8th highest XG total and the 5th lowest XGA total.

However, the fact that we have a good XGA, and yet we are significantly out performing even that, is the major reason for our current successful position.
This for me is where I have a concern.

We are broadly scoring as many as we should, but are significantly overperforming in defence.

Now, it might be that we are doing something in defence that causes to concede fewer than we "should" - or it may be unsustainable, and we might see a regression to the mean.

Of course, the longer we overperform, the less impact the rest of the season can have on our position....
 
Thanks for these graphs.

Am I right to think that WBA at home have scored a lot less than they should have ?
Hope they don't find their shooting boots this week

Also conceded a lot less ?

Our reserve defence needs help from teammates to stop chance creation.
And our attack needs to create more than last Friday coz we need 3 good chances to make their net bulge.
 
Magic , you suggest that teams who are significantly overperforming their Xg/XgA can be expected to slide down the actual table.
In light of the fact that we are significantly overperforming our XgA , do you expect us to slide down from top to 8th ?

Before looking at Xg/XgA stats , most Blades would have said that so far to his season our defence is excellent but there's something not quite right about how we attack.

Attack
Your figures suggest that we are converting chances at the expected rate - so in order to score more goals we need to create more chances , is that right ?

Defence
We are conceding less than half our XgA - what does this mean ?
Is it that every team we face just can't convert all the chances we give them , so it's luck really ?
And our luck will run out so we'll drop down the actual table ?
Or is it that a clear chance is gifted by us , but then an incredible save or last ditch tackle or block prevents a goal ?
So if our goalie & defenders keep performing (despite presenting chances) we'll be ok ?

In other words , to stay in the autos :

have we got some more work to do to create more chances for ourselves ?

and a lot more work to do to cut down the number of chances we are presenting (16.7) because eventually our luck will turn and we'll be conceding all 16.7 and not 9 ?
 
Wow - quite a read Graphman, but keep it coming!

Keen Blade The XG stuff becomes more relevant as the sample gets bigger. If you play against a crap keeper you will probably outperform XG, but as the number of matchdays pass it is unlikely that happens very often. Similarly if you play against a keeper who has a blinder you will probably underperform XG, but it doesn’t happen every week. The converse argument obviously applies to XGA and your defence & keeper.

So the fact that we are consistently meeting XG and consistently beating XGA after more than a third of a season makes it now start to be statistically relevant. By now if you consistently over or underperform XG and/or XGA you are likely to continue to do so, unless other factors come in such as injuries, sales, purchases etc.

Of course, results are based on goal difference so the best indicator of a likelihood to rise or fall in league position is the rate of change of the difference between actual and expected goal difference (!), but when you get to that depth it’s equivalent to starting to sell unstable financial derivatives - and we know how that ended!

UTB & FTP!
 
This for me is where I have a concern.

We are broadly scoring as many as we should, but are significantly overperforming in defence.

Now, it might be that we are doing something in defence that causes to concede fewer than we "should" - or it may be unsustainable, and we might see a regression to the mean.

Of course, the longer we overperform, the less impact the rest of the season can have on our position....
Having a Prem-level keeper like Cooper in net means we should consistently outperform our XPa. Plus we do seem to have players with the mentality and physically to get in a bunch of last ditch blocks/clearances. But I agree the size of the gap looks unsustainably large, especially if we get more injuries and suspensions.

We need to create more chances to balance this out. The front line seems to be clicking over the last few games, so I’m hopeful that we will.
 
Having a Prem-level keeper like Cooper in net means we should consistently outperform our XPa
It would be interesting to see if there is a Post Shot xG model that demonstrates this - a light google offers me nothing
 
The Sunlan match was a great game to watch. They came to win, and we had a tense open game. They were better than us first half and probably our equal after the break, but they definitely faded towards the end. That wasn’t surprising – all their goals in November have been scored in the first 35 minutes, and against Coventry and Millwall they were ahead but conceded equalisers in the 84th and 93rd minutes.

The ref got all the big decisions right – so he didn’t affect the outcome. Pivotal moments, apart from the goal, were obviously GoalCooper’s penalty save and the 2 red cards. I thought we played well all over the pitch, although I don’t think JRS is as effective when the match is quite physical – getting knocked off the ball quite easily. Tom Davies getting the goal was just fantastic – as he is such a gritty bloke in the way he plays as well as the way that he has handled his injuries. Finally, as I put in a post after the match, I think that Seriki changed the whole momentum of the game, and through that the result, when he came on.

So, on to the graphs

Graph 1 compares our progress against 3 benchmark sets of results which represent Automatic Promotion, Playoff Certainty and Playoff Possibility. My benchmarks take account of who our opponents are each week. On 38 points, comparing to my benchmarks, we are still bang on my Autos Promotion schedule – and without the deduction we would be 2 points ahead – this schedule has a draw against the Baggies next Sunday.

Graph 1
:
View attachment 198542


Graph 2
compares this season against our last 3 successful promotions from this level (all in second place), in 2005/06, 2018/19 and 2022/23. On 38 points after 18 games (with the 2-point deduction) we are 7 points ahead of the 31 points that we had under Wilder in 18/19, 6 ahead of Hecky in 22/23 and 6 points behind Warnock in 05/06.

So this is still our best Championship start since 2005, and is significantly better than our last 2 promotion seasons – and that includes that deduction!

Graph 2:
View attachment 198543


Next, the coloured annotated up-to-date League Table, which highlights where our strengths and weaknesses are against opponents’ league positions. Blades are now loud and proud at the top of the pile. As everybody expected, Leeds, Burnley and Boro are our biggest threats – Sunderland have started to fall away, as would probably be expected from such a young side.

League Table:
View attachment 198544


Before the start of the season, I posted my predicted league positions for the end of the season and Chart 1 reviews each team’s current position relative to my end of season forecast position.

Chart 1:
View attachment 198545


The big overperformers compared to my forecast are Blackburn and Wendy and the biggest underperformers compared to my forecast are Hull, Luton and Coventry. So I am expecting Blackburn and Wendy to slip down the table as the season progresses. (However, I’m very happy that Blackburn outperformed my expectations on Saturday and removed a few “Dirty Weeds”!) Similarly, I’m expecting Hull, Luton and Coventry to work their way up the table over the coming weeks.


Moving on to XG data (for the more nerdy amongst us!) - this is my review of Blades XG performance and general Championship XG stats. The purpose of this is simply to assess how teams are performing relative to their XG data – ie if a team’s results are better than their XG data it would suggest that they are overperforming and likely to slip back – and vice versa.

On Friday November 26th we beat Sunderland 1-0 at Bramall Lane.

The XG data for the game was Blades 0.8 – Sunderland 2.0. (
This emphasises that our defence is why we are doing so well. On average the chances created in the game suggest we should have lost 2-1, and yet we won 1-0.)

Graph 3 shows a comparison of the progress of our actual goals for and against with our XG expected goals for and against over our 18 games so far. XG says that over those 18 games we should have scored 23.3 and conceded 16.7 and we have actually scored 25 and conceded 9. So, we are performing above our XG in scoring and much better than average against our XGA in defence for the chances that we are creating and allowing. Putting that into context with other teams, we have the 8th highest XG total and the 5th lowest XGA total.

However, the fact that we have a good XGA, and yet we are significantly out performing even that, is the major reason for our current successful position.

Graph 3:
View attachment 198546


Chart 2
is the XTable - based on both team’s XG’s in matches played – alongside the actual League Table. Blades are 4th in the XTable and 1st in the actual League table, so our actual results are better than our XG stats would imply. This outperformance is actually even greater, because the XTable does not apply the 2-point deduction. If the deduction were applied we would only be 8th in the XTable. As discussed above, our outperformance is driven by having only conceded 9 goals against an XGA of 16.7.

Blackburn are the biggest overperformers here – being 8th in the actual table but 19th in the XTable. Coventry are the exact opposite, being 16th in the actual table but 5th in the XTable. I think that it is interesting that the big over/under performers compared to the XTable in Chart 2 are very similar to those compared to my end-of-season forecast in Chart 1.

Chart 2:
View attachment 198547


So, overall the stats show that our actual results are better than our XG performance and represent a certain playoff/likely automatics position. As mentioned, we are 8th best in XG, but we are 5th best in XGA, behind only Burnley, Leeds, Millwall and Middlesbrough. Our average XGA of 0.93 goals per game is a fairly good figure, but we are significantly outperforming that by delivering an actual average of only 0.5 goals against per game, a figure only beaten by Burnley. It is the outperformance of our XGA which leads to our outperforming our XG league position.


Teams like Blackburn, Watford, Wendy, and Oxford are overachieving significantly against their performance and might be expected to slip down the table. Conversely, teams like Coventry, Luton and QPR are significantly underachieving against their performance and would be expected to move up the table.

Our next game is on November 23rd away at West Brom. They have scored just 4 goals in their 8 home games with an XG of 11.5 and conceded 3 with an XGA of 7.6. So the actual stats would certainly suggest 0-0 and the XG stats probably 1-1. However, I will forecast a 1-0 Blades win, with 0-0 and 1-1 as the next 2 most likely results.

So that’s it for another excellent week. Apologies if you don’t enjoy the XG stuff – I may separate it into a separate post next week (as this post has probably got a bit too much content!)

UTB & Slava Ukraini!
It’s great. Keep it as it is. If people don’t like it, they can skip bits. Only a suggestion and it is just a suggestion, on the first main graph, put an abbreviation for the team and the score.

Greatly appreciated - UTB
 
When we have played Burnley on Boxing Day, based on the current table, we will have played seven of the top half away and only four at home.

Could make for a very exciting second half at BDTBL
 
The XGA has been skewed somewhat over the last week as we played a full half of 10 v 11 against Coventry and also conceded a penalty which counted for half of the XGA v Sunderland. Against Stoke, Blackburn, Wednesday and Oxford, our XGA was all below 1
 
The XGA has been skewed somewhat over the last week as we played a full half of 10 v 11 against Coventry and also conceded a penalty which counted for half of the XGA v Sunderland. Against Stoke, Blackburn, Wednesday and Oxford, our XGA was all below 1
That is why XG becomes more relevant as the season progresses, because an individual deviation from the norm has a progressively lower impact overall.

UTB & FTP!
 

Thanks for these graphs.

Am I right to think that WBA at home have scored a lot less than they should have ?
Hope they don't find their shooting boots this week

Also conceded a lot less ?

Our reserve defence needs help from teammates to stop chance creation.
And our attack needs to create more than last Friday coz we need 3 good chances to make their net bulge.
Yes anything less than one shot one goal. Is total failure
 
That is why XG becomes more relevant as the season progresses, because an individual deviation from the norm has a progressively lower impact overall.
See - I would argue that xG actually becomes less relevant over the season.

If you have played 40 games, and are 12 points clear of 3rd - then the fact that you are under or over performing your xG becomes far less important as a predictive factor to how the season ends.

At halfway - its far more likely that if your results are much better or worse than your advance metric suggest - that you can expect some regression to the mean.

Fundamentally the advance metrics are an indicator of whether, overall, you are doing things in the right way - the fact we sit 4th in the xTable indicates we are indeed doing the right things - and the longer we can continue to eek out results - the less impactful any regression to the mean will be.

As an aside - you only have to look at Coventry for a clear demonstration that, ultimately, it is results that matter, not performances. They sit 5th in the xTable and still sacked their manager.
 
I don't disagree - but you shouldn't think that your overall XG is showing anything significant after less than 10 games if you conceded a penalty and scored a 25 yarder in your last match, whereas if that was after 30 games the overall numbers are still significant.

In reality our XG tells us some very simple things - we have a great defence, we have acceptably efficient strikers and, if anything, we could do with creating a few more scoring opportunities - but if it ain't broke don't fix it!

Robins' sacking was a clash of personalities with King over the sacking of Assistant Viveash without board approval. Their poor early season results did, however, allow King to get away with it (just!). If Coventry had been Top 6 he would have had to wait for another opportunity!

Coventry will finish top half and could well make the playoffs - they just need to tighten up at the back.

UTB & FTP!
 

All advertisments are hidden for logged in members, why not log in/register?

All advertisments are hidden for logged in members, why not log in/register?

Back
Top Bottom