ucandomagic
Well-Known Member
The Sunlan match was a great game to watch. They came to win, and we had a tense open game. They were better than us first half and probably our equal after the break, but they definitely faded towards the end. That wasn’t surprising – all their goals in November have been scored in the first 35 minutes, and against Coventry and Millwall they were ahead but conceded equalisers in the 84th and 93rd minutes.
The ref got all the big decisions right – so he didn’t affect the outcome. Pivotal moments, apart from the goal, were obviously GoalCooper’s penalty save and the 2 red cards. I thought we played well all over the pitch, although I don’t think JRS is as effective when the match is quite physical – getting knocked off the ball quite easily. Tom Davies getting the goal was just fantastic – as he is such a gritty bloke in the way he plays as well as the way that he has handled his injuries. Finally, as I put in a post after the match, I think that Seriki changed the whole momentum of the game, and through that the result, when he came on.
So, on to the graphs
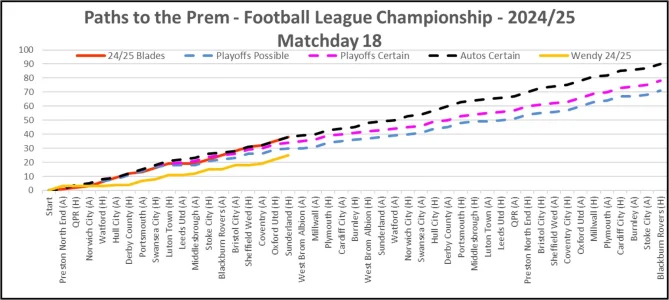
Graph 1 compares our progress against 3 benchmark sets of results which represent Automatic Promotion, Playoff Certainty and Playoff Possibility. My benchmarks take account of who our opponents are each week. On 38 points, comparing to my benchmarks, we are still bang on my Autos Promotion schedule – and without the deduction we would be 2 points ahead – this schedule has a draw against the Baggies next Sunday.
Graph 1:

Graph 2 compares this season against our last 3 successful promotions from this level (all in second place), in 2005/06, 2018/19 and 2022/23. On 38 points after 18 games (with the 2-point deduction) we are 7 points ahead of the 31 points that we had under Wilder in 18/19, 6 ahead of Hecky in 22/23 and 6 points behind Warnock in 05/06.
So this is still our best Championship start since 2005, and is significantly better than our last 2 promotion seasons – and that includes that deduction!
Graph 2:

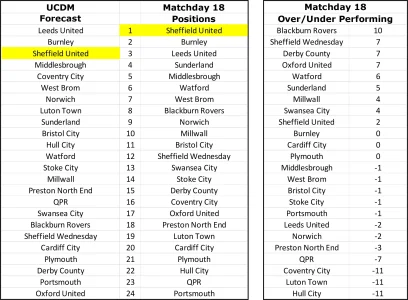
Next, the coloured annotated up-to-date League Table, which highlights where our strengths and weaknesses are against opponents’ league positions. Blades are now loud and proud at the top of the pile. As everybody expected, Leeds, Burnley and Boro are our biggest threats – Sunderland have started to fall away, as would probably be expected from such a young side.
League Table:

Before the start of the season, I posted my predicted league positions for the end of the season and Chart 1 reviews each team’s current position relative to my end of season forecast position.
Chart 1:

The big overperformers compared to my forecast are Blackburn and Wendy and the biggest underperformers compared to my forecast are Hull, Luton and Coventry. So I am expecting Blackburn and Wendy to slip down the table as the season progresses. (However, I’m very happy that Blackburn outperformed my expectations on Saturday and removed a few “Dirty Weeds”!) Similarly, I’m expecting Hull, Luton and Coventry to work their way up the table over the coming weeks.
Moving on to XG data (for the more nerdy amongst us!) - this is my review of Blades XG performance and general Championship XG stats. The purpose of this is simply to assess how teams are performing relative to their XG data – ie if a team’s results are better than their XG data it would suggest that they are overperforming and likely to slip back – and vice versa.
On Friday November 26th we beat Sunderland 1-0 at Bramall Lane.
The XG data for the game was Blades 0.8 – Sunderland 2.0. (This emphasises that our defence is why we are doing so well. On average the chances created in the game suggest we should have lost 2-1, and yet we won 1-0.)
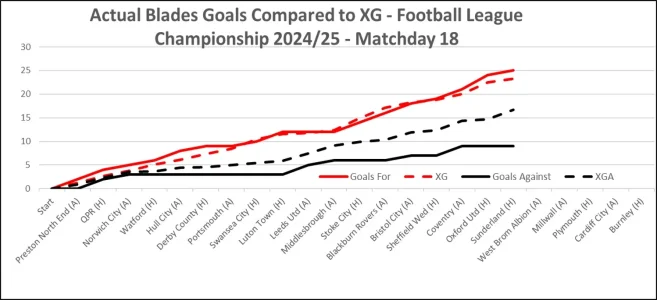
Graph 3 shows a comparison of the progress of our actual goals for and against with our XG expected goals for and against over our 18 games so far. XG says that over those 18 games we should have scored 23.3 and conceded 16.7 and we have actually scored 25 and conceded 9. So, we are performing above our XG in scoring and much better than average against our XGA in defence for the chances that we are creating and allowing. Putting that into context with other teams, we have the 8th highest XG total and the 5th lowest XGA total.
However, the fact that we have a good XGA, and yet we are significantly out performing even that, is the major reason for our current successful position.
Graph 3:

Chart 2 is the XTable - based on both team’s XG’s in matches played – alongside the actual League Table. Blades are 4th in the XTable and 1st in the actual League table, so our actual results are better than our XG stats would imply. This outperformance is actually even greater, because the XTable does not apply the 2-point deduction. If the deduction were applied we would only be 8th in the XTable. As discussed above, our outperformance is driven by having only conceded 9 goals against an XGA of 16.7.
Blackburn are the biggest overperformers here – being 8th in the actual table but 19th in the XTable. Coventry are the exact opposite, being 16th in the actual table but 5th in the XTable. I think that it is interesting that the big over/under performers compared to the XTable in Chart 2 are very similar to those compared to my end-of-season forecast in Chart 1.
Chart 2:

So, overall the stats show that our actual results are better than our XG performance and represent a certain playoff/likely automatics position. As mentioned, we are 8th best in XG, but we are 5th best in XGA, behind only Burnley, Leeds, Millwall and Middlesbrough. Our average XGA of 0.93 goals per game is a fairly good figure, but we are significantly outperforming that by delivering an actual average of only 0.5 goals against per game, a figure only beaten by Burnley. It is the outperformance of our XGA which leads to our outperforming our XG league position.
Teams like Blackburn, Watford, Wendy, and Oxford are overachieving significantly against their performance and might be expected to slip down the table. Conversely, teams like Coventry, Luton and QPR are significantly underachieving against their performance and would be expected to move up the table.
Our next game is on November 23rd away at West Brom. They have scored just 4 goals in their 8 home games with an XG of 11.5 and conceded 3 with an XGA of 7.6. So the actual stats would certainly suggest 0-0 and the XG stats probably 1-1. However, I will forecast a 1-0 Blades win, with 0-0 and 1-1 as the next 2 most likely results.
So that’s it for another excellent week. Apologies if you don’t enjoy the XG stuff – I may separate it into a separate post next week (as this post has probably got a bit too much content!)
UTB & Slava Ukraini!
The ref got all the big decisions right – so he didn’t affect the outcome. Pivotal moments, apart from the goal, were obviously GoalCooper’s penalty save and the 2 red cards. I thought we played well all over the pitch, although I don’t think JRS is as effective when the match is quite physical – getting knocked off the ball quite easily. Tom Davies getting the goal was just fantastic – as he is such a gritty bloke in the way he plays as well as the way that he has handled his injuries. Finally, as I put in a post after the match, I think that Seriki changed the whole momentum of the game, and through that the result, when he came on.
So, on to the graphs
Graph 1 compares our progress against 3 benchmark sets of results which represent Automatic Promotion, Playoff Certainty and Playoff Possibility. My benchmarks take account of who our opponents are each week. On 38 points, comparing to my benchmarks, we are still bang on my Autos Promotion schedule – and without the deduction we would be 2 points ahead – this schedule has a draw against the Baggies next Sunday.
Graph 1:

Graph 2 compares this season against our last 3 successful promotions from this level (all in second place), in 2005/06, 2018/19 and 2022/23. On 38 points after 18 games (with the 2-point deduction) we are 7 points ahead of the 31 points that we had under Wilder in 18/19, 6 ahead of Hecky in 22/23 and 6 points behind Warnock in 05/06.
So this is still our best Championship start since 2005, and is significantly better than our last 2 promotion seasons – and that includes that deduction!
Graph 2:

Next, the coloured annotated up-to-date League Table, which highlights where our strengths and weaknesses are against opponents’ league positions. Blades are now loud and proud at the top of the pile. As everybody expected, Leeds, Burnley and Boro are our biggest threats – Sunderland have started to fall away, as would probably be expected from such a young side.
League Table:

Before the start of the season, I posted my predicted league positions for the end of the season and Chart 1 reviews each team’s current position relative to my end of season forecast position.
Chart 1:

The big overperformers compared to my forecast are Blackburn and Wendy and the biggest underperformers compared to my forecast are Hull, Luton and Coventry. So I am expecting Blackburn and Wendy to slip down the table as the season progresses. (However, I’m very happy that Blackburn outperformed my expectations on Saturday and removed a few “Dirty Weeds”!) Similarly, I’m expecting Hull, Luton and Coventry to work their way up the table over the coming weeks.
Moving on to XG data (for the more nerdy amongst us!) - this is my review of Blades XG performance and general Championship XG stats. The purpose of this is simply to assess how teams are performing relative to their XG data – ie if a team’s results are better than their XG data it would suggest that they are overperforming and likely to slip back – and vice versa.
On Friday November 26th we beat Sunderland 1-0 at Bramall Lane.
The XG data for the game was Blades 0.8 – Sunderland 2.0. (This emphasises that our defence is why we are doing so well. On average the chances created in the game suggest we should have lost 2-1, and yet we won 1-0.)
Graph 3 shows a comparison of the progress of our actual goals for and against with our XG expected goals for and against over our 18 games so far. XG says that over those 18 games we should have scored 23.3 and conceded 16.7 and we have actually scored 25 and conceded 9. So, we are performing above our XG in scoring and much better than average against our XGA in defence for the chances that we are creating and allowing. Putting that into context with other teams, we have the 8th highest XG total and the 5th lowest XGA total.
However, the fact that we have a good XGA, and yet we are significantly out performing even that, is the major reason for our current successful position.
Graph 3:

Chart 2 is the XTable - based on both team’s XG’s in matches played – alongside the actual League Table. Blades are 4th in the XTable and 1st in the actual League table, so our actual results are better than our XG stats would imply. This outperformance is actually even greater, because the XTable does not apply the 2-point deduction. If the deduction were applied we would only be 8th in the XTable. As discussed above, our outperformance is driven by having only conceded 9 goals against an XGA of 16.7.
Blackburn are the biggest overperformers here – being 8th in the actual table but 19th in the XTable. Coventry are the exact opposite, being 16th in the actual table but 5th in the XTable. I think that it is interesting that the big over/under performers compared to the XTable in Chart 2 are very similar to those compared to my end-of-season forecast in Chart 1.
Chart 2:

So, overall the stats show that our actual results are better than our XG performance and represent a certain playoff/likely automatics position. As mentioned, we are 8th best in XG, but we are 5th best in XGA, behind only Burnley, Leeds, Millwall and Middlesbrough. Our average XGA of 0.93 goals per game is a fairly good figure, but we are significantly outperforming that by delivering an actual average of only 0.5 goals against per game, a figure only beaten by Burnley. It is the outperformance of our XGA which leads to our outperforming our XG league position.
Teams like Blackburn, Watford, Wendy, and Oxford are overachieving significantly against their performance and might be expected to slip down the table. Conversely, teams like Coventry, Luton and QPR are significantly underachieving against their performance and would be expected to move up the table.
Our next game is on November 23rd away at West Brom. They have scored just 4 goals in their 8 home games with an XG of 11.5 and conceded 3 with an XGA of 7.6. So the actual stats would certainly suggest 0-0 and the XG stats probably 1-1. However, I will forecast a 1-0 Blades win, with 0-0 and 1-1 as the next 2 most likely results.
So that’s it for another excellent week. Apologies if you don’t enjoy the XG stuff – I may separate it into a separate post next week (as this post has probably got a bit too much content!)
UTB & Slava Ukraini!
Last edited:
