ucandomagic
Active Member
I haven't been posting graphs - because it seemed a bit masochistic/sadistic to keep demonstrating to yourself and to everybody else how shit we've been.
However, now that we've been slightly less shit - and now that there's another thread comparing Wilder and Hecky - it's probably worth dropping a few graphs in (just for you ThirdGen!)
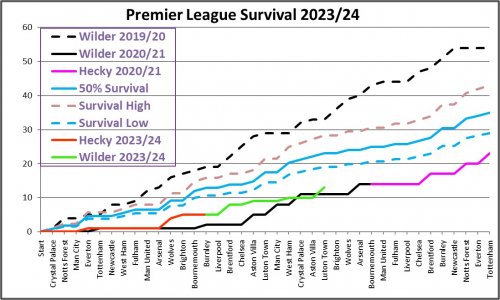
Graph 1 compares this season to our last 2 in the Prem - and you can see that we've just been dancing around the shitstorm that was 2020/21 - Hecky kept us slightly above it, Wilder took us slightly below it and has just brought us back slightly above it.
In terms of survival (!) which is not really a matter of sensible debate at the moment - you can also see on Graph 1 that we are 6 points adrift of statistically any chance - and 10 points adrift of a statistically 50% chance. However, in a season which is very odd - with a good number of teams struggling and with points deductions having happened and more possible in the future - history probably goes out of the window.
Graph 1:

What is true is that you need to score more goals than you concede to win - and somebody asked me a while back to keep a record of average goals for and against.
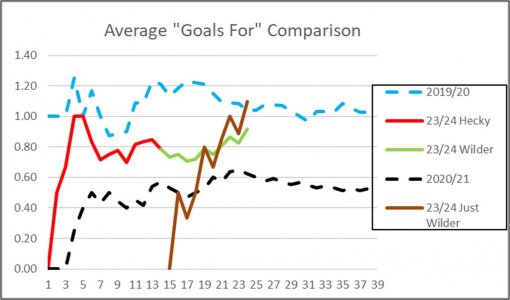
Graph 2 shows our running average of goals for. From Graph 2 you can see that all season we've averaged somewhere in between the goals that we scored in our last 2 Prem seasons - which, in terms of performance, is probably where we were aiming. Hecky left us on just under 0.8 per game and Wilder has got that overall average up to just over 0.9 - Wilder's individual average since he started is up at 1.1. So goal-scoring wise we're doing nearly as well as the season that we finished 9th.
Graph 2:

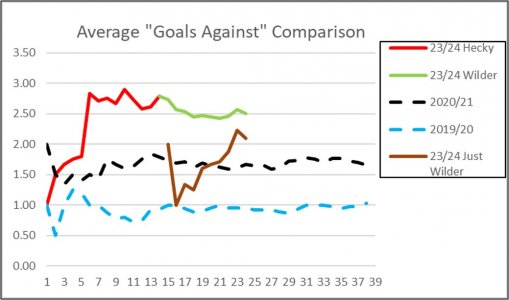
Graph 3 is the shitstorm. In our really bad season in 2020/21 we had an average of conceding around 1.7 or 1.8. In our good season in 2019/20 we averaged about a goal a game conceded. Hecky left us conceding an average over 2.7 per game (!) and Wilder has squeezed that overall average down to about 2.5. Mind you the average in just Wilder's games is still 2.1 conceded.
Graph 3:

Again, averages can be deceptive, as a few 8-0 and 5-0 results can blur the situation! However, overall averages and even Wilder's average goals conceded is still worse than a 2020/21 season that we considered a disaster. Our defence has always had a slow soft centre. Teams with quick skillful players like Barcodes and Villa jut run through it. We did better against some Mad Hatters - but generally they tried round and over us, which we defend better.
Big Vinnie can be a big difference - our soft slow centre needs protecting, and he is the man to do it - keep him bang centre in front of the back 3 or 4 - let nobody run past - not the Norwood sad gaze and point as they disappear!
So, at the moment, it is what it is. Try to keep the back door closed and see where that gets us.
UTB & Slava Ukraini!
However, now that we've been slightly less shit - and now that there's another thread comparing Wilder and Hecky - it's probably worth dropping a few graphs in (just for you ThirdGen!)
Graph 1 compares this season to our last 2 in the Prem - and you can see that we've just been dancing around the shitstorm that was 2020/21 - Hecky kept us slightly above it, Wilder took us slightly below it and has just brought us back slightly above it.
In terms of survival (!) which is not really a matter of sensible debate at the moment - you can also see on Graph 1 that we are 6 points adrift of statistically any chance - and 10 points adrift of a statistically 50% chance. However, in a season which is very odd - with a good number of teams struggling and with points deductions having happened and more possible in the future - history probably goes out of the window.
Graph 1:

What is true is that you need to score more goals than you concede to win - and somebody asked me a while back to keep a record of average goals for and against.
Graph 2 shows our running average of goals for. From Graph 2 you can see that all season we've averaged somewhere in between the goals that we scored in our last 2 Prem seasons - which, in terms of performance, is probably where we were aiming. Hecky left us on just under 0.8 per game and Wilder has got that overall average up to just over 0.9 - Wilder's individual average since he started is up at 1.1. So goal-scoring wise we're doing nearly as well as the season that we finished 9th.
Graph 2:

Graph 3 is the shitstorm. In our really bad season in 2020/21 we had an average of conceding around 1.7 or 1.8. In our good season in 2019/20 we averaged about a goal a game conceded. Hecky left us conceding an average over 2.7 per game (!) and Wilder has squeezed that overall average down to about 2.5. Mind you the average in just Wilder's games is still 2.1 conceded.
Graph 3:

Again, averages can be deceptive, as a few 8-0 and 5-0 results can blur the situation! However, overall averages and even Wilder's average goals conceded is still worse than a 2020/21 season that we considered a disaster. Our defence has always had a slow soft centre. Teams with quick skillful players like Barcodes and Villa jut run through it. We did better against some Mad Hatters - but generally they tried round and over us, which we defend better.
Big Vinnie can be a big difference - our soft slow centre needs protecting, and he is the man to do it - keep him bang centre in front of the back 3 or 4 - let nobody run past - not the Norwood sad gaze and point as they disappear!
So, at the moment, it is what it is. Try to keep the back door closed and see where that gets us.
UTB & Slava Ukraini!


