ucandomagic
Well-Known Member
As usual, this is my very simple weekly review of Blades XG performance and general Championship XG stats. The purpose of this is simply to assess how teams are performing relative to their XG data – ie if a team’s results are better than their XG data it would suggest then that they are overperforming and likely to slip back – and vice versa.
I get the weekend data on Tuesday afternoon and try to post my summary on Tuesday evening. I get the stats from footballxg.com.
This week we have had 2 games to add to the data:-
On Wednesday October 2nd we beat Swansea 1-0 with an own goal.
The XG data for the Swansea game was Blades 2.2 - Swansea 0.6
On Saturday October 5th we beat Luton 2-0.
The XG data for the Luton game was Blades 1.2 – Luton 0.4
Graph 1 shows a comparison of the progress of our actual goals for and against with our XG expected goals for and against over our 9 games so far. XG says that over those 9 games we should have scored 11.8 and conceded 6.1 and we have actually scored 12 and conceded 3. So, we are performing almost exactly to our XG in scoring but much better than average against our XGA in defence for the chances that we are creating and allowing.
Graph 1:

Chart 1 is a measure of over/under Championship performance based on general chances created/allowed. The numbers in Chart 1 are a measure of a team’s expected goal difference against their actual goal difference, ie (XG-XGA) minus actual goal difference. The detail of this doesn't matter, but in my mind the top third of this chart are overperforming and could be expected to slip down in league position, unless they have an exceptionally clinical strikeforce and/or an exceptional goalkeeper. The middle third are probably matching the chances they create and allow, and the bottom third are underperforming and could be expected to move up the league unless they have a particularly poor strikeforce and/or a particularly weak goalkeeper.
Chart 1:

So, performance-wise, the Blades actual results are doing slightly better than their XG performance. The difference is more than last week, mostly because we continued our run of actual clean sheets. Our XGA’s of 0.6 and 0.4 this week continue to emphasise the leading role that our defence is playing in our overall performance. I mentioned in another thread this week that I think the key to our developing sustainable success is building a solid defensive record, which doesn't mean parking the bus but pressing hard from front to back and solid defence of crosses and set pieces, alongside a quality GoalCooper!
As I mentioned above, we have scored 12 with an XG of 11.8 and conceded 3 with an XGA of 6.1. Burnley, at the top of Chart 1 however, have scored 14 goals with an XG of only 8.4 and conceded 4 goals with an XGA of 7.1. They continue to outscore their XG with high-tariff goals.
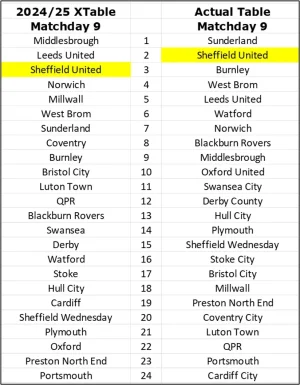
Chart 2 shows the XTable - based on team XG's in matches played – alongside the actual League Table. Blades are 3rd in the XTable compared to 2nd in the actual League table so, as observed above, our results pretty accurately reflect our XG stats. Burnley, however, are 9th in the XTable compared to 4th in the actual League Table, emphasising their unusually high-tariff goal-scoring record. The biggest differences in the XTable from the actual League Table are Millwall, who are 13 places below their XTable position and Coventry who are 12 places below their XTable position. Conversely, Oxford are 12 places above their XTable position.
Chart 2:

So, overall the stats would still suggest that our results are a reasonably accurate reflection of our XG performance and represent a certain playoff, possible autos position. Our position is based firmly on a sound defence. The average XGA of 0.67 goals per game is a good figure, but we are even outperforming that by delivering an actual average of 0.33 goals against per game, half of the average XGA.
Teams like Burnley, Blackburn, Oxford and Sunderland continue to overachieve significantly against their performance and might be expected to slip down the table, whereas teams like Cardiff, Luton and Coventry are significantly underachieving against their performance and would be expected to move up the table.
So that’s it for another week.
Next 2 games are away at Leeds and away at Boro. XG averages would suggest a 1-1 draw or a 2-1 defeat at Elland Road and a 2-1 defeat at the Riverside, but who believes stats? If we can continue our clean sheet run maybe we can pinch another couple of 1-nils!
I enjoyed watching Aaron Rodgers looking poor on Sunday and admired Sam Darnold (with longing Raiders eyes)! I get to see for myself whether Caleb Williams is up to it next Sunday. I suspect he's this year's Bryce Young!
UTB & Slava Ukraini!
I get the weekend data on Tuesday afternoon and try to post my summary on Tuesday evening. I get the stats from footballxg.com.
This week we have had 2 games to add to the data:-
On Wednesday October 2nd we beat Swansea 1-0 with an own goal.
The XG data for the Swansea game was Blades 2.2 - Swansea 0.6
On Saturday October 5th we beat Luton 2-0.
The XG data for the Luton game was Blades 1.2 – Luton 0.4
Graph 1 shows a comparison of the progress of our actual goals for and against with our XG expected goals for and against over our 9 games so far. XG says that over those 9 games we should have scored 11.8 and conceded 6.1 and we have actually scored 12 and conceded 3. So, we are performing almost exactly to our XG in scoring but much better than average against our XGA in defence for the chances that we are creating and allowing.
Graph 1:

Chart 1 is a measure of over/under Championship performance based on general chances created/allowed. The numbers in Chart 1 are a measure of a team’s expected goal difference against their actual goal difference, ie (XG-XGA) minus actual goal difference. The detail of this doesn't matter, but in my mind the top third of this chart are overperforming and could be expected to slip down in league position, unless they have an exceptionally clinical strikeforce and/or an exceptional goalkeeper. The middle third are probably matching the chances they create and allow, and the bottom third are underperforming and could be expected to move up the league unless they have a particularly poor strikeforce and/or a particularly weak goalkeeper.
Chart 1:

So, performance-wise, the Blades actual results are doing slightly better than their XG performance. The difference is more than last week, mostly because we continued our run of actual clean sheets. Our XGA’s of 0.6 and 0.4 this week continue to emphasise the leading role that our defence is playing in our overall performance. I mentioned in another thread this week that I think the key to our developing sustainable success is building a solid defensive record, which doesn't mean parking the bus but pressing hard from front to back and solid defence of crosses and set pieces, alongside a quality GoalCooper!
As I mentioned above, we have scored 12 with an XG of 11.8 and conceded 3 with an XGA of 6.1. Burnley, at the top of Chart 1 however, have scored 14 goals with an XG of only 8.4 and conceded 4 goals with an XGA of 7.1. They continue to outscore their XG with high-tariff goals.
Chart 2 shows the XTable - based on team XG's in matches played – alongside the actual League Table. Blades are 3rd in the XTable compared to 2nd in the actual League table so, as observed above, our results pretty accurately reflect our XG stats. Burnley, however, are 9th in the XTable compared to 4th in the actual League Table, emphasising their unusually high-tariff goal-scoring record. The biggest differences in the XTable from the actual League Table are Millwall, who are 13 places below their XTable position and Coventry who are 12 places below their XTable position. Conversely, Oxford are 12 places above their XTable position.
Chart 2:

So, overall the stats would still suggest that our results are a reasonably accurate reflection of our XG performance and represent a certain playoff, possible autos position. Our position is based firmly on a sound defence. The average XGA of 0.67 goals per game is a good figure, but we are even outperforming that by delivering an actual average of 0.33 goals against per game, half of the average XGA.
Teams like Burnley, Blackburn, Oxford and Sunderland continue to overachieve significantly against their performance and might be expected to slip down the table, whereas teams like Cardiff, Luton and Coventry are significantly underachieving against their performance and would be expected to move up the table.
So that’s it for another week.
Next 2 games are away at Leeds and away at Boro. XG averages would suggest a 1-1 draw or a 2-1 defeat at Elland Road and a 2-1 defeat at the Riverside, but who believes stats? If we can continue our clean sheet run maybe we can pinch another couple of 1-nils!
I enjoyed watching Aaron Rodgers looking poor on Sunday and admired Sam Darnold (with longing Raiders eyes)! I get to see for myself whether Caleb Williams is up to it next Sunday. I suspect he's this year's Bryce Young!
UTB & Slava Ukraini!

