ucandomagic
Well-Known Member
I delayed this until today so that I could include all of the weekend XG data, which comes in at 4pm on Tuesdays.
The experience was great for our young team on Sunday, and will be really beneficial to them in the future. I thought that we were sound all over the pitch, but Big Harry, Vini and Gus were outstanding. The goal was real quality – Gus with a disappearing act and a pass, Cal with a subtle touch and Tyrese with another clinical strike. I reckon Gus has lost a bit of timber and gained a yard of pace as well. Sydie, Femi and Ryan were all excellent when they came on – on the pitch our young boys are now definitely men! Hopefully Blaster will be recovered after a very timely international break.
So, on to the graphs
As usual, Graph 1 compares our progress against 3 benchmark sets of results which represent Automatic Promotion, Playoff Certainty and Playoff Possibility. My benchmarks take account of who our opponents are each week. On 31 points, comparing to my benchmarks, we are still bang on my Autos schedule – and of course without the deduction we would even be 2 points ahead of that.
Graph 1:

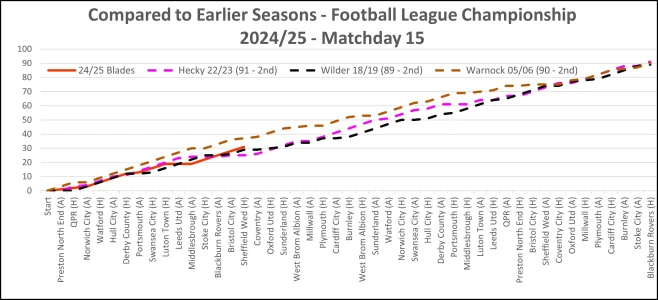
Graph 2 compares this season against our last 3 successful promotions from this level (all in second place), in 2005/06, 2018/19 and 2022/23. On 31 points (with the 2-point deduction) we are 2 ahead of the 29 points that we had under Wilder in 18/19, 6 ahead of Hecky in 22/23 and now just 6 points behind Warnock’s great start in 05/06.
So this is our best Championship start since 2005, and is better than our last 2 promotion seasons – and that includes the 2-point deduction!
Graph 2:
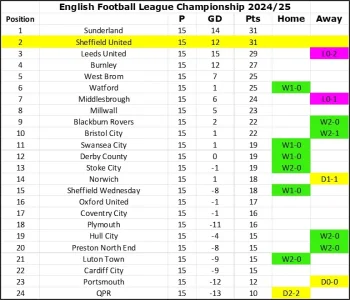
Next, the coloured annotated up-to-date League Table, which highlights where our strengths and weaknesses are against opponents’ league positions. Blades are now in 2nd place, level on points with Sunderland, 2 points ahead of Leeds and 4 ahead of Burnley. That green home column with all the zeros is something else, apart from that late QPR equaliser it’s a full house of wins.
League Table:
Moving on to XG data - this is my review of Blades XG performance and general Championship XG stats. The purpose of this is simply to assess how teams are performing relative to their XG data – ie if a team’s results are better than their XG data it would suggest that they are overperforming and likely to slip back – and vice versa.
On Sunday November 10th we beat Wendy 1-0 at Bramall Lane.
The XG data for the game was Blades 0.5 – Wendy 0.6
Graph 3 shows a comparison of the progress of our actual goals for and against with our XG expected goals for and against over our 15 games so far. XG says that over those 15 games we should have scored 18.7 and conceded 12.5 and we have actually scored 19 and conceded 7. So, we are still performing exactly to our XG in scoring and much better than average against our XGA in defence for the chances that we are creating and allowing.
Our biggest area for improvement is definitely creating chances rather than finishing them. To put it in context, we are only 11th highest in XG. We average below 1.5 at home – but have got away with that because of those 6 clean sheets. I feel that we need to play 2 up front, particularly at home and particularly as Big Kieff is more of a target-man than a clinical finisher. Tyrese is proving to be a chip off the old block with finishing and should work well alongside Kieffer. We need him there for the flick-ons if nothing else.
Graph 3:
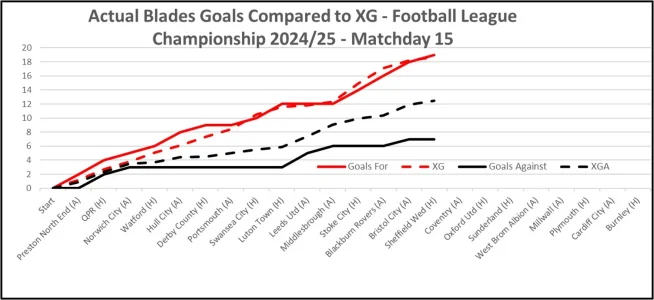
Chart 1 is a measure of over/under Championship performance based on general chances created/allowed. The numbers in Chart 1 are a measure of a team’s expected goal difference against their actual goal difference, ie (XG-XGA) minus actual goal difference. The detail of this doesn't matter, but in my mind the top third of this chart are overperforming and could be expected to slip down in league position, unless they have an exceptionally clinical strikeforce and/or an exceptional goalkeeper. The middle third are probably matching the chances they create and allow, and the bottom third are underperforming and could be expected to move up the league unless they have a particularly poor strikeforce and/or a particularly weak goalkeeper.
Chart 1:
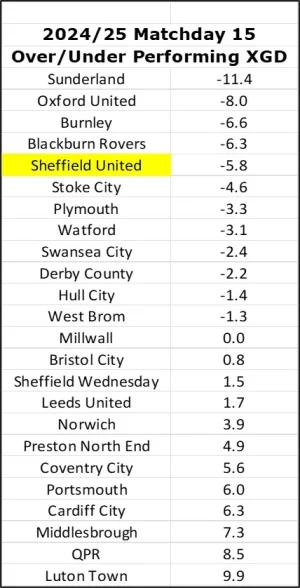
So, performance-wise, the Blades’ actual performance this season is a bit better than their XG performance. This is a result of a lot of clean sheets, at least matching XG while beating XGA in each game. The 2 teams at the extremes of Chart 1 are Luton and Sunderland. Luton’s problem is at the back – a poor XGA of 19.7 but an even worse actual record, having conceded 26. At the other end, Sunderland’s goals scored are 135% of their XG. However, this Sunderland overperformance is reducing, and I would expect them to move down the table a little over the next few weeks.
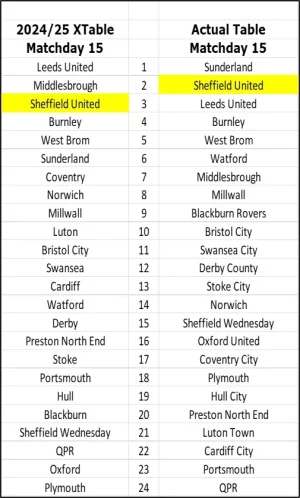
Chart 2 is the XTable - based on both team’s XG’s in matches played – alongside the actual League Table. Blades are 3rd in the XTable and 2nd in the actual League table so, as observed above, our results pretty accurately reflect our XG stats. Blackburn are the biggest overperformers here – being 9th in the actual table but 20th in the XTable. Luton are the exact opposite, being 21st in the actual table but 10th in the XTable. As described above, this reflects the fact that they have conceded 6 more goals than their XGA.
Chart 2:
So, overall the stats continue to suggest that our results are a reasonably accurate reflection of our XG performance and represent a certain playoff/likely automatics position. Our poor creation of good chances means that our position is based firmly on a sound defence. As mentioned, we are 11th best in XG, but we are 3rd best in XGA, behind only Leeds and Burnley. Our average XGA of 0.83 goals per game is a fairly good figure, but we are even outperforming that by delivering an actual average of 0.47 goals against per game, a figure only beaten by Burnley.
Teams like Sunderland, Burnley, Oxford and Blackburn continue to overachieve significantly against their performance and might be expected to slip down the table, whereas teams like Middlesbrough, Luton and QPR are significantly underachieving against their performance and would be expected to move up the table.
Our next game is on November 23rd away at Coventry. They have scored 12 goals in their 7 home games with an XG of 11.9 and conceded 11 with an XGA of 6.5. Their stats would probably suggest 2-2, but with our defensive record I would forecast a 2-1 Blades win. However, with Robins now gone much will depend on their managerial situation. They could be getting a new manager bounce but, if they appoint Lampard I would forecast a 3-1 Blades win!
So that’s it for another excellent week.
UTB & Slava Ukraini!
The experience was great for our young team on Sunday, and will be really beneficial to them in the future. I thought that we were sound all over the pitch, but Big Harry, Vini and Gus were outstanding. The goal was real quality – Gus with a disappearing act and a pass, Cal with a subtle touch and Tyrese with another clinical strike. I reckon Gus has lost a bit of timber and gained a yard of pace as well. Sydie, Femi and Ryan were all excellent when they came on – on the pitch our young boys are now definitely men! Hopefully Blaster will be recovered after a very timely international break.
So, on to the graphs
As usual, Graph 1 compares our progress against 3 benchmark sets of results which represent Automatic Promotion, Playoff Certainty and Playoff Possibility. My benchmarks take account of who our opponents are each week. On 31 points, comparing to my benchmarks, we are still bang on my Autos schedule – and of course without the deduction we would even be 2 points ahead of that.
Graph 1:

Graph 2 compares this season against our last 3 successful promotions from this level (all in second place), in 2005/06, 2018/19 and 2022/23. On 31 points (with the 2-point deduction) we are 2 ahead of the 29 points that we had under Wilder in 18/19, 6 ahead of Hecky in 22/23 and now just 6 points behind Warnock’s great start in 05/06.
So this is our best Championship start since 2005, and is better than our last 2 promotion seasons – and that includes the 2-point deduction!
Graph 2:

Next, the coloured annotated up-to-date League Table, which highlights where our strengths and weaknesses are against opponents’ league positions. Blades are now in 2nd place, level on points with Sunderland, 2 points ahead of Leeds and 4 ahead of Burnley. That green home column with all the zeros is something else, apart from that late QPR equaliser it’s a full house of wins.
League Table:

Moving on to XG data - this is my review of Blades XG performance and general Championship XG stats. The purpose of this is simply to assess how teams are performing relative to their XG data – ie if a team’s results are better than their XG data it would suggest that they are overperforming and likely to slip back – and vice versa.
On Sunday November 10th we beat Wendy 1-0 at Bramall Lane.
The XG data for the game was Blades 0.5 – Wendy 0.6
Graph 3 shows a comparison of the progress of our actual goals for and against with our XG expected goals for and against over our 15 games so far. XG says that over those 15 games we should have scored 18.7 and conceded 12.5 and we have actually scored 19 and conceded 7. So, we are still performing exactly to our XG in scoring and much better than average against our XGA in defence for the chances that we are creating and allowing.
Our biggest area for improvement is definitely creating chances rather than finishing them. To put it in context, we are only 11th highest in XG. We average below 1.5 at home – but have got away with that because of those 6 clean sheets. I feel that we need to play 2 up front, particularly at home and particularly as Big Kieff is more of a target-man than a clinical finisher. Tyrese is proving to be a chip off the old block with finishing and should work well alongside Kieffer. We need him there for the flick-ons if nothing else.
Graph 3:

Chart 1 is a measure of over/under Championship performance based on general chances created/allowed. The numbers in Chart 1 are a measure of a team’s expected goal difference against their actual goal difference, ie (XG-XGA) minus actual goal difference. The detail of this doesn't matter, but in my mind the top third of this chart are overperforming and could be expected to slip down in league position, unless they have an exceptionally clinical strikeforce and/or an exceptional goalkeeper. The middle third are probably matching the chances they create and allow, and the bottom third are underperforming and could be expected to move up the league unless they have a particularly poor strikeforce and/or a particularly weak goalkeeper.
Chart 1:

So, performance-wise, the Blades’ actual performance this season is a bit better than their XG performance. This is a result of a lot of clean sheets, at least matching XG while beating XGA in each game. The 2 teams at the extremes of Chart 1 are Luton and Sunderland. Luton’s problem is at the back – a poor XGA of 19.7 but an even worse actual record, having conceded 26. At the other end, Sunderland’s goals scored are 135% of their XG. However, this Sunderland overperformance is reducing, and I would expect them to move down the table a little over the next few weeks.
Chart 2 is the XTable - based on both team’s XG’s in matches played – alongside the actual League Table. Blades are 3rd in the XTable and 2nd in the actual League table so, as observed above, our results pretty accurately reflect our XG stats. Blackburn are the biggest overperformers here – being 9th in the actual table but 20th in the XTable. Luton are the exact opposite, being 21st in the actual table but 10th in the XTable. As described above, this reflects the fact that they have conceded 6 more goals than their XGA.
Chart 2:

So, overall the stats continue to suggest that our results are a reasonably accurate reflection of our XG performance and represent a certain playoff/likely automatics position. Our poor creation of good chances means that our position is based firmly on a sound defence. As mentioned, we are 11th best in XG, but we are 3rd best in XGA, behind only Leeds and Burnley. Our average XGA of 0.83 goals per game is a fairly good figure, but we are even outperforming that by delivering an actual average of 0.47 goals against per game, a figure only beaten by Burnley.
Teams like Sunderland, Burnley, Oxford and Blackburn continue to overachieve significantly against their performance and might be expected to slip down the table, whereas teams like Middlesbrough, Luton and QPR are significantly underachieving against their performance and would be expected to move up the table.
Our next game is on November 23rd away at Coventry. They have scored 12 goals in their 7 home games with an XG of 11.9 and conceded 11 with an XGA of 6.5. Their stats would probably suggest 2-2, but with our defensive record I would forecast a 2-1 Blades win. However, with Robins now gone much will depend on their managerial situation. They could be getting a new manager bounce but, if they appoint Lampard I would forecast a 3-1 Blades win!
So that’s it for another excellent week.
UTB & Slava Ukraini!
