Reasons To Believe - Matchday 11 Graphs

All advertisments are hidden for logged in members, why not log in/register?

ucandomagic

Active Member
Joined
Dec 16, 2013
Messages
2,406
Reaction score
8,733
Location
Studley
He’s not just a right back, he’s John Brayford George Baldock. That’s what Phipps said about The Beard to justify what we spent on him. What he meant was that he brought a lot more to the game than just playing it. Baldock’s last start was against Everton and his unwavering belief is contagious. With George, Robbo, Thomas and Souza we have a steel curtain that can get us out of this mess. Hamer was everywhere, Macca changed the game up front and Archer may be invisible when we don’t have the ball, but stick it in front of him with a sight of goal and he’s worth every penny.

I haven’t posted graphs for a bit – as seeing us flatlining on one point was depressing. So today is a new dawn.

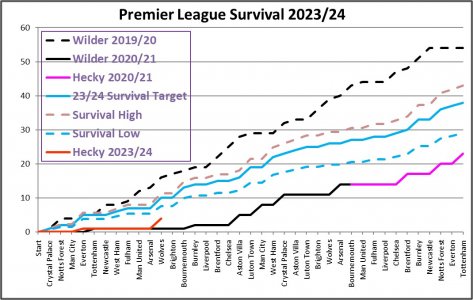
Graph 1 is the plot that compares our progress against our last 2 Prem seasons and against my benchmark results to achieve survival. I’ve developed the survival lines a bit. In the 20 team Prem history 38 points would have kept you up in 75% of the seasons – so my main survival line is a set of results to get 38 points. I’ve now added a highest (43) and lowest (29) set of results to show the spread that has been possible for survival over the 28 seasons.

Our red line has moved up towards the survival lines a bit, and has finally lifted away from the 20/21 Wilder season!

Graph 1:
Matchday 11 - Survival Graph.jpg


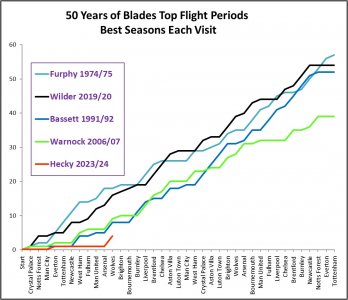
Graph 2
plots our progress against the best seasons from each of the previous 4 periods that I have watched the Blades in the top flight. The early seasons have been modified to account for 3 point wins and 20 teams. I have used the actual results against the top 19 teams in each of those years. It’s interesting that we’re still only 4 points behind Bassett’s best season in 91/92, which ended with us finishing 9th. (The Notts County and West Ham results in 91/92 have been excluded as they finished 21st and 22nd)
Graph 2:
Matchday 11 Best Prem Comparison.jpg


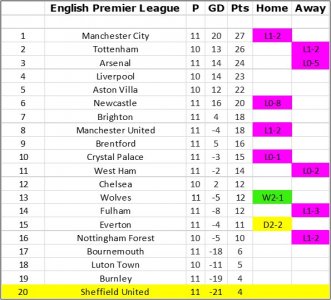
Finally the League Table – still not encouraging, but we are very much still in touch with the 3 above us. The good thing about being at the bottom end is that everybody around you usually loses as well! Those home games against the bottom half are going to be vital.

League Table:
Matchday 11 - Table.jpg


Our situation after the next 3 games against Brighton, Bournemouth and Burnley will tell us a lot about our chances of staying up,

UTB & Slava Ukraini
 

He’s not just a right back, he’s John Brayford George Baldock. That’s what Phipps said about The Beard to justify what we spent on him. What he meant was that he brought a lot more to the game than just playing it. Baldock’s last start was against Everton and his unwavering belief is contagious. With George, Robbo, Thomas and Souza we have a steel curtain that can get us out of this mess. Hamer was everywhere, Macca changed the game up front and Archer may be invisible when we don’t have the ball, but stick it in front of him with a sight of goal and he’s worth every penny.

I haven’t posted graphs for a bit – as seeing us flatlining on one point was depressing. So today is a new dawn.

Graph 1 is the plot that compares our progress against our last 2 Prem seasons and against my benchmark results to achieve survival. I’ve developed the survival lines a bit. In the 20 team Prem history 38 points would have kept you up in 75% of the seasons – so my main survival line is a set of results to get 38 points. I’ve now added a highest (43) and lowest (29) set of results to show the spread that has been possible for survival over the 28 seasons.

Our red line has moved up towards the survival lines a bit, and has finally lifted away from the 20/21 Wilder season!

Graph 1:
View attachment 174133


Graph 2
plots our progress against the best seasons from each of the previous 4 periods that I have watched the Blades in the top flight. The early seasons have been modified to account for 3 point wins and 20 teams. I have used the actual results against the top 19 teams in each of those years. It’s interesting that we’re still only 4 points behind Bassett’s best season in 91/92, which ended with us finishing 9th. (The Notts County and West Ham results in 91/92 have been excluded as they finished 21st and 22nd)
Graph 2:
View attachment 174134


Finally the League Table – still not encouraging, but we are very much still in touch with the 3 above us. The good thing about being at the bottom end is that everybody around you usually loses as well! Those home games against the bottom half are going to be vital.

League Table:
View attachment 174135


Our situation after the next 3 games against Brighton, Bournemouth and Burnley will tell us a lot about our chances of staying up,

UTB & Slava Ukraini

Brilliant stuff GraphMan.
Good to see you back.
Your posts always put everything in perspective for me.
UTB
 
Love these graphs pal, don't blame you for the hiatus whilst we were flatlining but very glad to see them return.
 
With 5 of the sides directly above us to play at home that's where the bulk of our points need to come from in all likelihood. I guess none of us at the bottom have played each other much judging by the current points tallies?
 
With 5 of the sides directly above us to play at home that's where the bulk of our points need to come from in all likelihood. I guess none of us at the bottom have played each other much judging by the current points tallies?
7 points from the next 3 and we’re on our way.

Less than 4 and we’re up the proverbial creek!
 
7 points from the next 3 and we’re on our way.

Less than 4 and we’re up the proverbial creek!
Disagree. Three points from the next three games wouldn't be a disaster as Brighton is mega-tough. Lose to Brighton and beat either Bournemouth or Burnley (or draw all three) and we're still in the mix.
 
The next four games are totally going to define our season, huge pressure but also a great opportunity.
 
Anyone remember the1990/91 season? Won our first game of the season on the 22nd December and finished the season 13th:-
 
League Table:
View attachment 174135


Our situation after the next 3 games against Brighton, Bournemouth and Burnley will tell us a lot about our chances of staying up,

UTB & Slava Ukraini
See this league table gives me a lot of hope - we haven`t played a single team below us in the table yet....

...oh
 
He’s not just a right back, he’s John Brayford George Baldock. That’s what Phipps said about The Beard to justify what we spent on him. What he meant was that he brought a lot more to the game than just playing it. Baldock’s last start was against Everton and his unwavering belief is contagious. With George, Robbo, Thomas and Souza we have a steel curtain that can get us out of this mess. Hamer was everywhere, Macca changed the game up front and Archer may be invisible when we don’t have the ball, but stick it in front of him with a sight of goal and he’s worth every penny.

I haven’t posted graphs for a bit – as seeing us flatlining on one point was depressing. So today is a new dawn.

Graph 1 is the plot that compares our progress against our last 2 Prem seasons and against my benchmark results to achieve survival. I’ve developed the survival lines a bit. In the 20 team Prem history 38 points would have kept you up in 75% of the seasons – so my main survival line is a set of results to get 38 points. I’ve now added a highest (43) and lowest (29) set of results to show the spread that has been possible for survival over the 28 seasons.

Our red line has moved up towards the survival lines a bit, and has finally lifted away from the 20/21 Wilder season!

Graph 1:
View attachment 174133


Graph 2
plots our progress against the best seasons from each of the previous 4 periods that I have watched the Blades in the top flight. The early seasons have been modified to account for 3 point wins and 20 teams. I have used the actual results against the top 19 teams in each of those years. It’s interesting that we’re still only 4 points behind Bassett’s best season in 91/92, which ended with us finishing 9th. (The Notts County and West Ham results in 91/92 have been excluded as they finished 21st and 22nd)
Graph 2:
View attachment 174134


Finally the League Table – still not encouraging, but we are very much still in touch with the 3 above us. The good thing about being at the bottom end is that everybody around you usually loses as well! Those home games against the bottom half are going to be vital.

League Table:
View attachment 174135


Our situation after the next 3 games against Brighton, Bournemouth and Burnley will tell us a lot about our chances of staying up,

UTB & Slava Ukraini
Great analysis thank you.

I think this year will be a record low points total to stay up.
 
That's very impressive" Graphy",although the bit you put about winning our home games against us is only relevant if we get something in the away games. If we win them all at home then lose them all away then no advantage.

Those home games against the bottom half are going to be vital.
 
With 5 of the sides directly above us to play at home that's where the bulk of our points need to come from in all likelihood. I guess none of us at the bottom have played each other much judging by the current points tallies?
Two games between the bottom four so far: Luton 1-2 Burnley and Bournemouth 2-1 Burnley.

1699281973638.png

ucandomagic as ever loving your work but the 38 points for survival is too high based on recent history: over the last 10 years the average is 34.
 

All advertisments are hidden for logged in members, why not log in/register?

All advertisments are hidden for logged in members, why not log in/register?

Back
Top Bottom