ucandomagic
Active Member
I've had a few comments about which graphs to plot next season – so I thought I’d flesh out some early ideas.
It’s 52 years since my first Lane memory in April ’71, and a John Flynn diving header in front of the Kop against Cardiff.
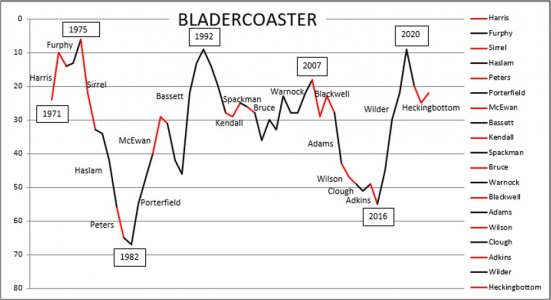
It’s been quite a ride since then – and my Bladercoaster chart below really highlights the ride, along with the men in the driving seat at the time. I’ve restricted myself to one manager a season or it gets too messy – and I always try to forget that Robson was ever here anyway!
You can clearly see our four top flight peaks. (Hecky's peak will go up at least 2 places next season anyway!).
Bladercoaster:

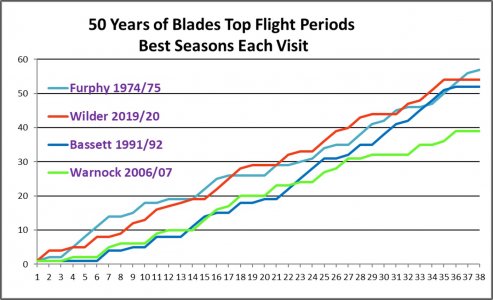
The Bladercoaster highlights our 4 periods in the top division, under Furphy, Bassett, Warnock and Wilder, so I think I’ll run a comparison against the best of each of those years – as shown below. I had to adjust for 42 game seasons by neglecting results against the bottom 2 – so it is a true comparison of results against the Top 19 clubs each season.
Best Top Flight Seasons:

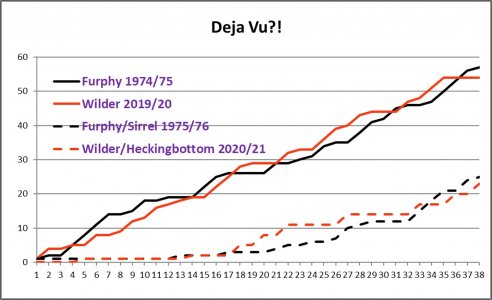
The above graph shows that the Furphy 1974/75 and Wilder 2019/20 season finishes were the best two – with Bassett 1991/92 pushing them close. However, in true Blades style, those 2 best seasons were immediately followed by our 2 worst seasons – as shown below.
Déjà Vu:

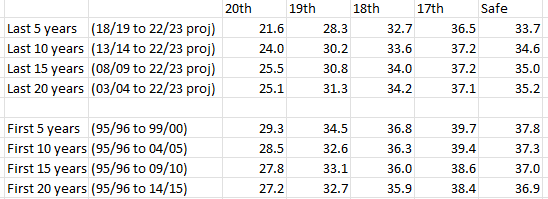
In the interest of keeping that in mind, and not getting too excited if our first year is going well, I will probably run a comparison with the above, to remind us of the best and the worst of earlier times! There’s plenty of room in between those to include a benchmark set of results for a 40-point safety season as well, which I’ll put together once we’ve got the fixture list.
So here we go again –
“When I get to the bottom I go back to the top of the slide - Helter Skelter”.
John Lennon.
UTB & Slava Ukraini
It’s 52 years since my first Lane memory in April ’71, and a John Flynn diving header in front of the Kop against Cardiff.
It’s been quite a ride since then – and my Bladercoaster chart below really highlights the ride, along with the men in the driving seat at the time. I’ve restricted myself to one manager a season or it gets too messy – and I always try to forget that Robson was ever here anyway!
You can clearly see our four top flight peaks. (Hecky's peak will go up at least 2 places next season anyway!).
Bladercoaster:

The Bladercoaster highlights our 4 periods in the top division, under Furphy, Bassett, Warnock and Wilder, so I think I’ll run a comparison against the best of each of those years – as shown below. I had to adjust for 42 game seasons by neglecting results against the bottom 2 – so it is a true comparison of results against the Top 19 clubs each season.
Best Top Flight Seasons:

The above graph shows that the Furphy 1974/75 and Wilder 2019/20 season finishes were the best two – with Bassett 1991/92 pushing them close. However, in true Blades style, those 2 best seasons were immediately followed by our 2 worst seasons – as shown below.
Déjà Vu:

In the interest of keeping that in mind, and not getting too excited if our first year is going well, I will probably run a comparison with the above, to remind us of the best and the worst of earlier times! There’s plenty of room in between those to include a benchmark set of results for a 40-point safety season as well, which I’ll put together once we’ve got the fixture list.
So here we go again –
“When I get to the bottom I go back to the top of the slide - Helter Skelter”.
John Lennon.
UTB & Slava Ukraini
Last edited:


