Navigation
Install the app
How to install the app on iOS
Follow along with the video below to see how to install our site as a web app on your home screen.

Note: This feature currently requires accessing the site using the built-in Safari browser.
More options
You are using an out of date browser. It may not display this or other websites correctly.
You should upgrade or use an alternative browser.
You should upgrade or use an alternative browser.
Championship attack and defense effectiveness
- Thread starter ThatJa
- Start date
All advertisments are hidden for logged in members, why not log in/register?
CornwallBlade
I got the ball ref!
- Joined
- May 14, 2017
- Messages
- 1,374
- Reaction score
- 2,439
Brilliant piece of work my friend- I love analysis like this 
I’d love to see the attack and defence data linked to possession stats to see if there really is any correlation between the two. Simple possession/results which is what MOTD etc show is, I’m sure, too simplistic.
I’d love to see the attack and defence data linked to possession stats to see if there really is any correlation between the two. Simple possession/results which is what MOTD etc show is, I’m sure, too simplistic.
South Sea Blade
Member
- Joined
- Jun 2, 2020
- Messages
- 716
- Reaction score
- 1,886
So looking at those two graphs it appears that Burnley And Sheffield United are the best two teams in the division - However, I wish there was some way of finding out this information in a clearer format.
")
Perhaps a quick look at a league table in early May could help !!So looking at those two graphs it appears that Burnley And Sheffield United are the best two teams in the division - However, I wish there was some way of finding out this information in a clearer format.
CaptainMorgans
Well-Known Member
- Joined
- Sep 8, 2011
- Messages
- 7,953
- Reaction score
- 19,149
Thanks for sharing. I appreciate analytics like this. I used to really enjoy listening to Jay on BladesPod. He offered great insight, presumably through reviewing similar data models.
I'd be intrigued to know whether models like this and XG do broadly even themselves out over the course of the season. A quick review of the last few season's data VS final league standings would provide the answers.
If they do, you could start (to an extent) to draw conclusions such as - "Burnley are probably due a drop off in front of goal," or "Swansea are due an up-tick in form" etc..
As above, the two best teams in the division are where they are for a reason and Middlesbrough (and maybe West Brom) represent the only threat to that.
Champagneblade
Well-Known Member
- Joined
- Jan 24, 2010
- Messages
- 10,920
- Reaction score
- 27,739
I think there were 4 shared the other day on one thread.
They all basically say fuck Burnley, Sheff U is where it's at!
 experimental361.com
They all basically say fuck Burnley, Sheff U is where it's at!
Scatter graphics: Championship, 11 Jan 2023
There have been just about enough matches played for a first outing of the scatter graphics. These compare the attacking and defensive performances of every team in a division – each of the f…
experimental361.com
Selly
Ask me about Updog...
As with anything, these are indications and ultimitely what happens on the pitch matters. Take last season finl xG table for the championship:Thanks for sharing. I appreciate analytics like this. I used to really enjoy listening to Jay on BladesPod. He offered great insight, presumably through reviewing similar data models.
I'd be intrigued to know whether models like this and XG do broadly even themselves out over the course of the season. A quick review of the last few season's data VS final league standings would provide the answers.
If they do, you could start (to an extent) to draw conclusions such as - "Burnley are probably due a drop off in front of goal," or "Swansea are due an up-tick in form" etc..
As above, the two best teams in the division are where they are for a reason and Middlesbrough (and maybe West Brom) represent the only threat to that.
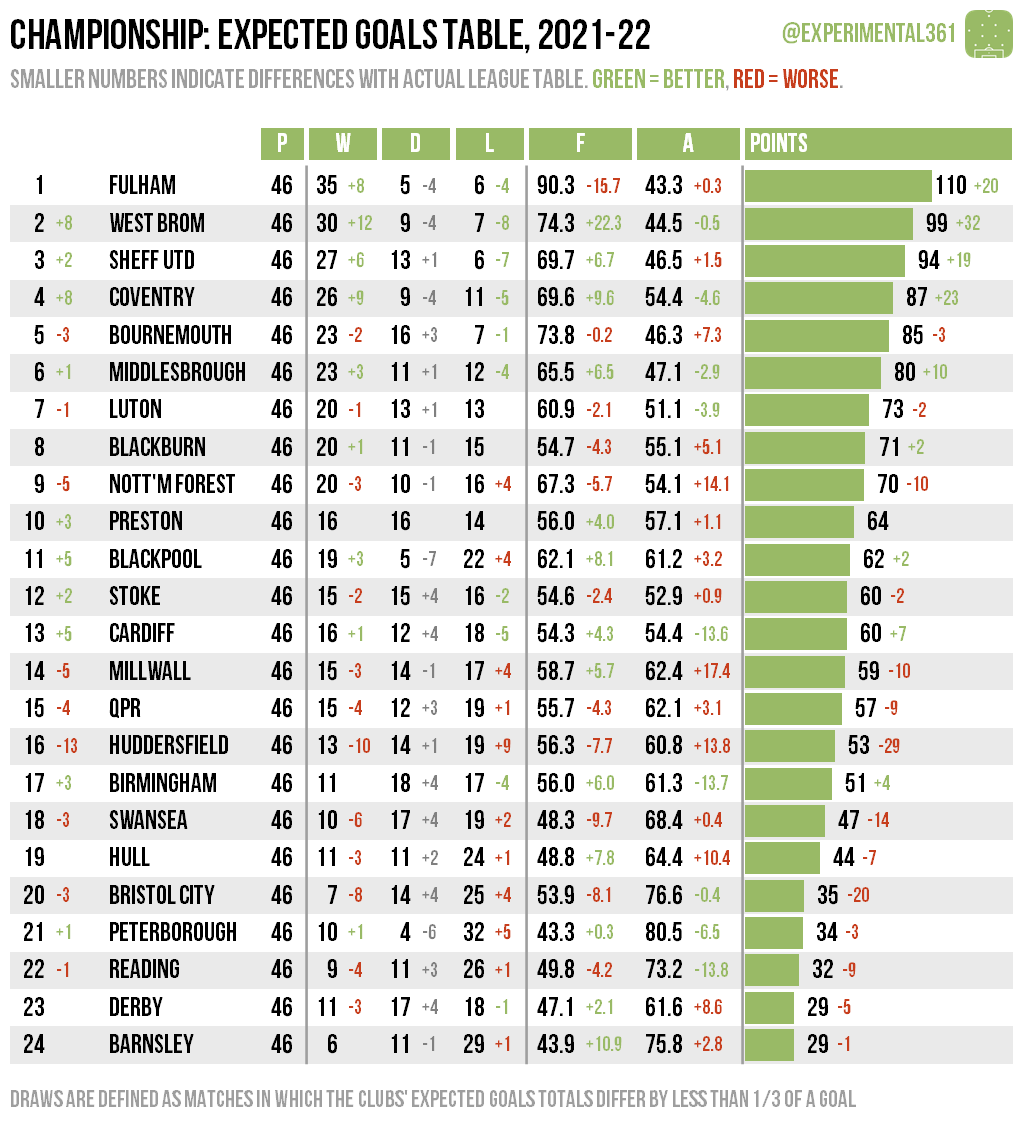
On the above, WBA should have gone up - but they didn`t because they didn`t get the results that (arguably) their performances warranted.
So when looking at the attacking and defensive performance graphs, what they show you is where a challenge is likely to come from. So from an attacking PoV, Boro, and Defensively WBA, Coventry and Millwall.
What is encouraging for us is:
- we are firmly top 2 in both graphs
- we have a significant points cushion
- The fewer games left, the less possibility there is of teams overperforming to the extent they would need to.
I'd be concerned if we were in the middle of those graphs, even with a 9 point cushion, as that would indicate we may have been overperforming.
I think there were 4 shared the other day on one thread.
They all basically say fuck Burnley, Sheff U is where it's at!
Scatter graphics: Championship, 11 Jan 2023
There have been just about enough matches played for a first outing of the scatter graphics. These compare the attacking and defensive performances of every team in a division – each of the f…
Yes, I look at these graphs and wonder why we aren't top by a considerable margin! 
Selly
Ask me about Updog...
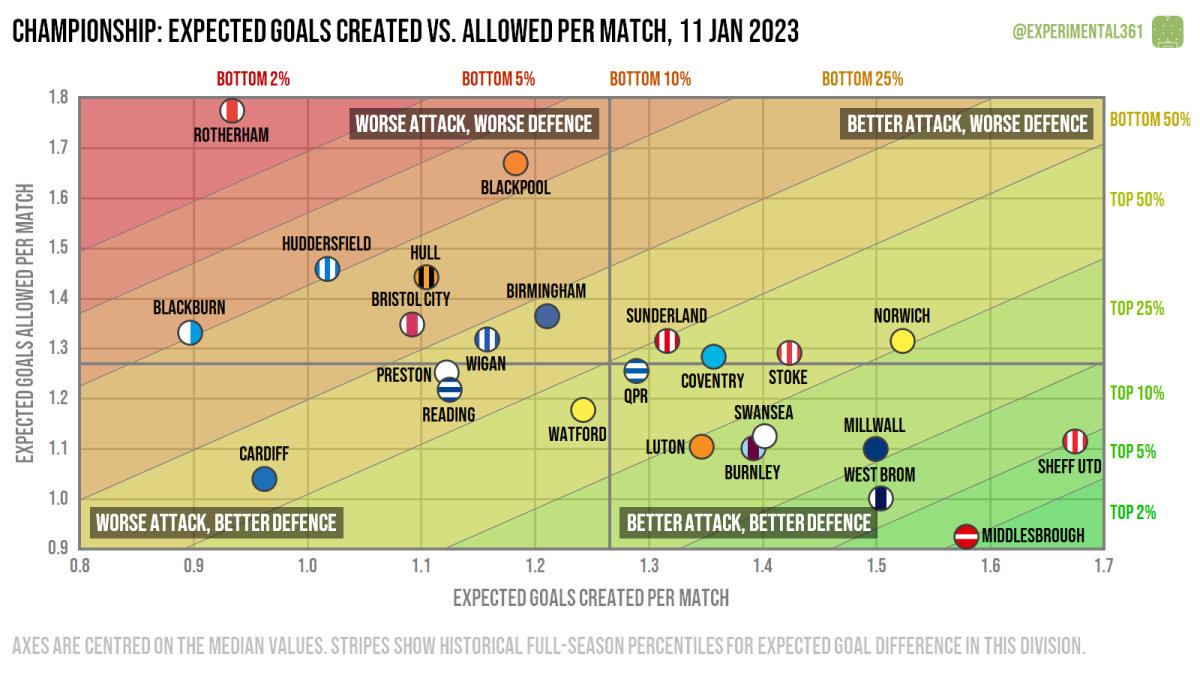
Because we are actually overperforming vs the quality of the chances that we create/give up. The current xG table show that:
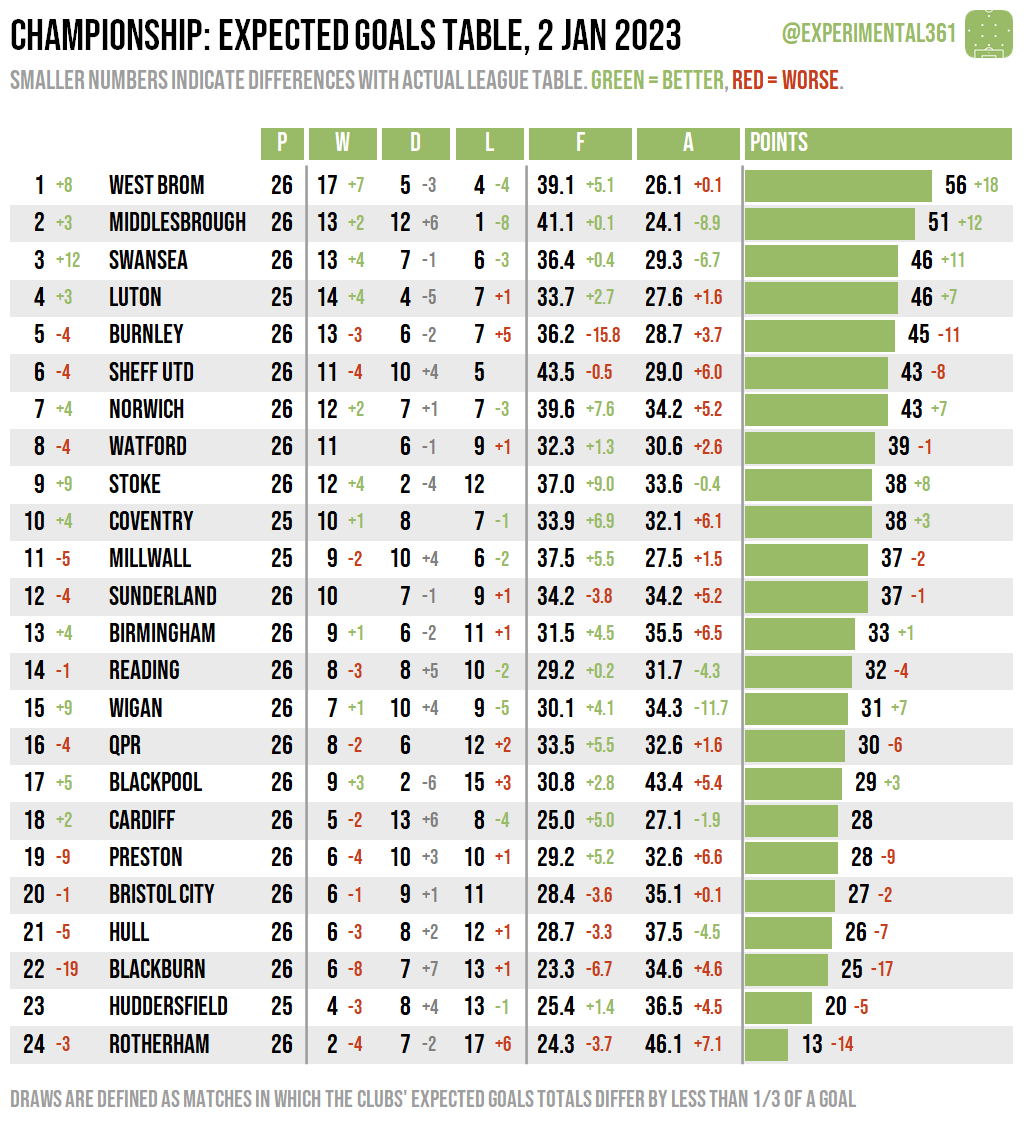
In short we probably shouldn`t be winning quite as many games as we are - based on the quality of the chances we create/give up - in fact if you look at the xGA we should have conceded 6 more goals than we have.
The good news is that the further we get into the season, and the longer we maintain our position/gap, the less relevant the above becomes. With 20 games left if WBA and Bore were to start accumulating points at the rate implied by the above, and we were to drop off to the level implied by the above, we would still get another 33 points, whereas they would get 43 and 39 respectively - not enough to overtake us.
Every win we get makes anyone catching us less likely - even if they win as well, as it reduced the number of games available to catch up.
It looks very positive at the moment - but lets see where we are in 10 games time.
Sheffsteel
Well-Known Member
- Joined
- Jul 18, 2015
- Messages
- 11,670
- Reaction score
- 23,394
An observation that I've had in many matches under Hecky and it does make me wonder if it's deliberate is
We seem to focus all our energies and tactics on creating chances and preventing the opposition from having chances
however the downside is we don't seem to make any attempt regards controlling midfield (the middle third), think it's because he prefers speedy/ direct attacking.
I remember Wilder used to sometimes say, we played well overall and he was pleased with our play in the middle third
but he'd then say the most important aspects of any match are the key moments in the attacking and defending thirds and that's where we need to improve.
Note: Under Jukanovic we were often excellent in the middle third and often controlled midfield with plenty of possession, this made our attacks slow.
so we struggled to create chances and the opposition wouldn't attack much but often looked dangerous creating decent chances,
So when people say we haven't played well (like against QPR), agree we didn't look good in the centre circle area but based on chances we still performed well.
Last edited:
Champagneblade
Well-Known Member
- Joined
- Jan 24, 2010
- Messages
- 10,920
- Reaction score
- 27,739
This is the issue with xG as a guide to an extent.Because we are actually overperforming vs the quality of the chances that we create/give up. The current xG table show that:
In short we probably shouldn`t be winning quite as many games as we are - based on the quality of the chances we create/give up - in fact if you look at the xGA we should have conceded 6 more goals than we have.
The good news is that the further we get into the season, and the longer we maintain our position/gap, the less relevant the above becomes. With 20 games left if WBA and Bore were to start accumulating points at the rate implied by the above, and we were to drop off to the level implied by the above, we would still get another 33 points, whereas they would get 43 and 39 respectively - not enough to overtake us.
Every win we get makes anyone catching us less likely - even if they win as well, as it reduced the number of games available to catch up.
It looks very positive at the moment - but lets see where we are in 10 games time.
You also have to have a complete team to be successful. If you create better chances but have shit strikers then that doesn’t equate to you somehow ought to be higher up. It just shows your limitations as a team.
If we happen to have better forwards, we can probably get away with slightly less chance creation because we’re probably playing out some games, dropping the tempo because the game is done.
But these teams have to keep plugging away because their forward can’t hit a cow’s arse with a banjo.
An xG chance falling to Billy Sharp has no differentiation compared to the same change falling to Chris Basham (no disrespect to Bash, I picked Him because he’s one of the longest without a goal).
Beans
Active Member
- Joined
- Mar 21, 2017
- Messages
- 2,087
- Reaction score
- 12,551
An observation that I've had in many matches under Hecky and it does make me wonder if it's deliberate is
We seem to focus all our energies and tactics on creating chances and preventing the opposition from having chances
however the downside is we don't seem to make any attempt regards controlling midfield (the middle third), think it's because he prefers speedy/ direct attacking.
I remember Wilder used to sometimes say, we played well overall and he was pleased with our play in the middle third
but he'd then say the most important aspects of any match are the key moments in the attacking and defending thirds and that's where we need to improve.
Note: Under Jukanovic we were often excellent in the middle third and often controlled midfield with plenty of possession, this made our attacks slow.
so we struggled to create chances and the opposition wouldn't attack much but often looked dangerous creating decent chances,
So when people say we haven't played well (like against QPR), agree we didn't look good in the centre circle area but based on chances we still performed well.
Opta do a "zones of control" map that shows where on the pitch we touch the ball more than the opposition (can see them for each team here and mouseover to see the specific percentages, scroll down a bit on that page). Blue areas are where we have more than 55% of the total touches, red are where our opponent has more than 55% of total touches, and the grey are the ones where the percentage falls somewhere in between (contested).

Kind of supports what you say - we try to get it to the flanks in the opposition third rather than faffing in the centre circle (although we still "contest" that area of the pitch). FWIW I think the red zone in the right-back spot is more a reflection on how attacking Anel / Baldock / Bogle are rather than a weakness - we don't have many touches in that spot because those players are usually much higher up the pitch.
Note: I think this visual is more representative of how teams play rather than how good they are. Swansea for example have a billion touches everywhere but are 15th, while Luton don't give a shit about having the ball and have a shot at making the playoffs again.


Sheffsteel
Well-Known Member
- Joined
- Jul 18, 2015
- Messages
- 11,670
- Reaction score
- 23,394
Note: I think this visual is more representative of how teams play rather than how good they are. Swansea for example have a billion touches everywhere but are 15th, while Luton don't give a shit about having the ball and have a shot at making the playoffs again.
Excellent point, interesting stuff.
Think there can be a massive difference between "looking good" and "being good" and quite often fans judge a team on how they look.
Club culture is also an interesting one.
We've tried going towards more of a Swansea style under Robson and Jukanovic and our fans hated the slower constant sideways passing just to keep possession.
Our fans have always preferred a quicker more direct game with plenty of goal mouth action.
Also over the decades, our fans have accepted lower technical standards as long as the players have character and give 100% effort.
Shit! I was looking at it from the wrong perspective, i.e. looking at the graphs we are clearly the best team, and Burnley are lucky to be top because the graphs show they're not as good as us, yet they're top.Because we are actually overperforming vs the quality of the chances that we create/give up. The current xG table show that:
In short we probably shouldn`t be winning quite as many games as we are - based on the quality of the chances we create/give up - in fact if you look at the xGA we should have conceded 6 more goals than we have.
The good news is that the further we get into the season, and the longer we maintain our position/gap, the less relevant the above becomes. With 20 games left if WBA and Bore were to start accumulating points at the rate implied by the above, and we were to drop off to the level implied by the above, we would still get another 33 points, whereas they would get 43 and 39 respectively - not enough to overtake us.
Every win we get makes anyone catching us less likely - even if they win as well, as it reduced the number of games available to catch up.
It looks very positive at the moment - but lets see where we are in 10 games time.
What you're saying makes sense to me now.
Even more worrying then that West Brom are on a real charge
Cheers.
Beans
Active Member
- Joined
- Mar 21, 2017
- Messages
- 2,087
- Reaction score
- 12,551
Excellent point, interesting stuff.
Think there can be a massive difference between "looking good" and "being good" and quite often fans judge a team on how they look.
Club culture is also an interesting one.
We've tried going towards more of a Swansea style under Robson and Jukanovic and our fans hated the slower constant sideways passing just to keep possession.
Our fans have always preferred a quicker more direct game with plenty of goal mouth action.
Also over the decades, our fans have accepted lower technical standards as long as the players have character and give 100% effort.
Completely agree with that. From what I can tell Russell Martin is quite well thought-of at Swansea but he'd be long gone if he was trying this with United. I suppose it looks "nice" being the most possession-dominant team in the league two years in a row but they finished 15th last year and that's exactly where they are so far season. It'd do my head in, the definition of madness and all that... I don't think our fans would stand for it.
As it happens, the season Swansea made the playoff final under Steve Cooper they averaged a mere 50.7% possession compared to 63-64%.
Selly
Ask me about Updog...
xG is, as with all stats/analytics, only a starting point.This is the issue with xG as a guide to an extent.
You also have to have a complete team to be successful. If you create better chances but have shit strikers then that doesn’t equate to you somehow ought to be higher up. It just shows your limitations as a team.
If we happen to have better forwards, we can probably get away with slightly less chance creation because we’re probably playing out some games, dropping the tempo because the game is done.
But these teams have to keep plugging away because their forward can’t hit a cow’s arse with a banjo.
An xG chance falling to Billy Sharp has no differentiation compared to the same change falling to Chris Basham (no disrespect to Bash, I picked Him because he’s one of the longest without a goal).
As you say, xG doesn`t look at the player that the chance is falling to - just the xG of an average player - if you have above average players (and we absolutely do) then you will probably score more than your xG - although we aren`t actually doing this - we are broadly dead on - where we are "overperforming" is at the back - we are stingy as hell, and probably should have had more goals scored against us - but we don`t because whilst the chances we allow add up to a relatively higher xGA, they are probably a lot of 10% chances rather than 2 or 3 40% chances...
Wes's post Shot xG is about spot on - so its the quality of the shots we allow that is causing the overperformance.
Of course some of this could easily regress to the mean - we haven`t played away at a lot of the top half of the table yet...
Similar threads
- Replies
- 2
- Views
- 951
- Replies
- 65
- Views
- 3K
- Replies
- 42
- Views
- 3K
- Replies
- 6
- Views
- 637
All advertisments are hidden for logged in members, why not log in/register?