ucandomagic
Active Member
A decent end to the season at the Blues – and definitely better than getting milked by the Udders!
A few end of season comparison graphs and charts today, combined with overviews of the whole season.
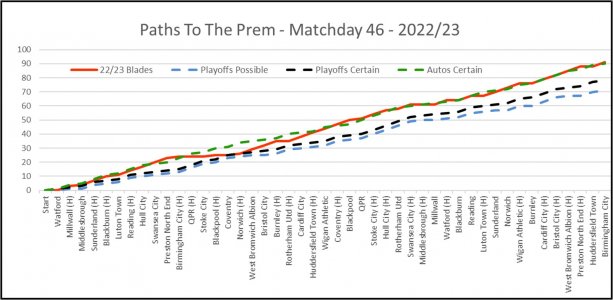
Graph 1 compares our season to my benchmark results for each game to achieve an automatic promotion or a playoff season. You can see from Graph 1 that on 91 points we ended 1 point above my Autos Certain line. This line was for a set of results, that I produced at the start of the season, which would achieve 90 points and almost certain automatics. Apart from our October blip, it is amazing how close our season ran against this benchmark
Graph 1:
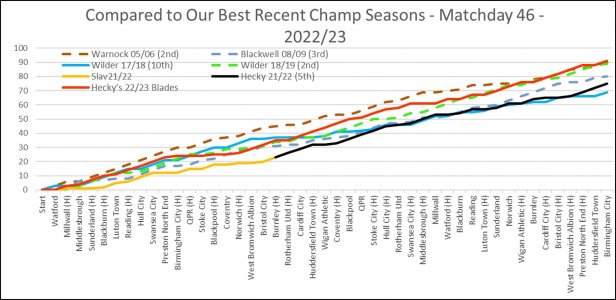
Graph 2 is the multiple comparison graph with our best recent Championship seasons. Graph 2 shows that at the end of the season, on 91 points we were 2 points ahead of our 89 points in Wilder’s promotion season in 18/19 and 1 point better off than Warnock’s 90 points in 05/06
Graph 2:
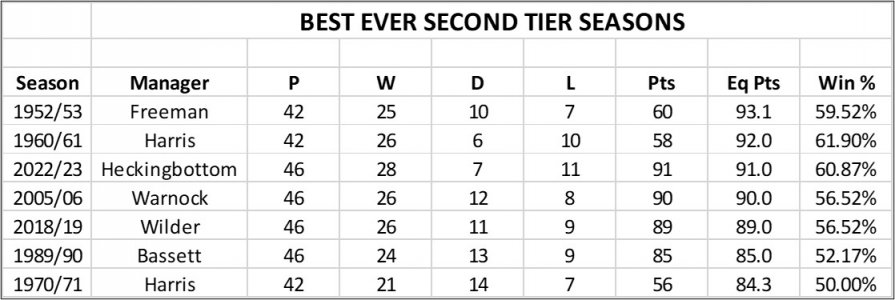
I guess that you’ll probably remember that I got quite excited when I realised that we could get 94 points, which would be our best equivalent points score ever at this level, beating the previous best in1953. In the end, as the table below shows, our 91 points was our best season at this level, since 1961. So Hecky had our best season at this level for over 60 years, and only sits behind Reg Freeman and John Harris in our all-time second tier legacy list.
Hecky’s Legacy Table:
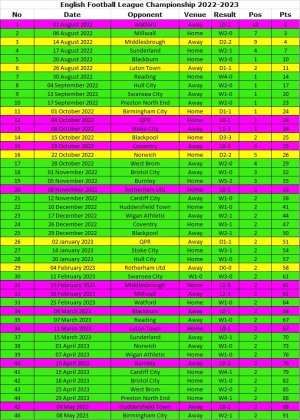
Next, I’ve put below a coloured version of our full season results over time. The October blip is very evident – 3 points from 6 games – and in the last game in that period we were 2 down to Norwich after about a quarter of an hour. We came back to 2-2 and then Adam Davies saved a Pukki penalty in extra time, so we squeezed a point. That was a real turning point.
After that, if we hadn’t lost at home to Rotherham, we would have gone 15 games without losing – the real backbone to our season. Even In that Rotherham game we dominated everything, just couldn’t score and only lost to a Ben Wiles goal – but as he is Eddie Colquohoun’s grandson and it helped keep the Millers up we’ll take that one for Eddie.
For the rest of the season we had no draws and we only lost to Top 10 sides, apart from Udders!
Chronological Results Table:
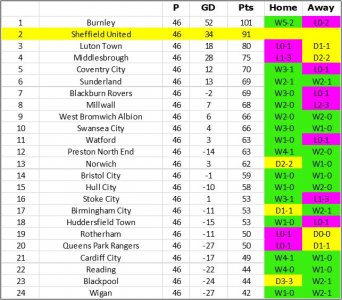
And finally the completed League Table. There are some interesting generalities very evident from the colour patterns on this table. We do best against teams who take us on and try to play against us. The sides in the Top 6 probably benefitted from that, and took significant points off us. We broke down most teams in the middle 12 and took good points off them. However, quite a few teams in the bottom third really frustrated us by sitting back and breaking. We got less from those games than we should have done, especially Rotherham and QPR.
Personally, I have taken that as a result of the lack of pace in Norwood, Fleck and Egan against attacks down the centre. I remember as well, last time in the Prem, a few games with balls over the top which caught us out and got Egan a couple of red cards. Doyle and McA address that issue quite well if they stay, but it was very evident also how much it helped against Preston having Anel’s pace in the centre at the back. Only my opinions, others may disagree.
League Table:
Overall, my 5th promotion to the top flight in 52 years – so a fantastic once in a decade season for me. I’m looking forward to setting up next season’s graphs – probably run a comparison with Wilder’s 2 Prem seasons – as they cover both the highs and lows! – and a benchmark set of results to get 40 points.
All comments on any of my thoughts above and suggestions for next year are very welcome.
As they say on trendy American YouTube channels – “This is Ucandomagic,; Peace, Out!”
UTB & Slava Ukraini
A few end of season comparison graphs and charts today, combined with overviews of the whole season.
Graph 1 compares our season to my benchmark results for each game to achieve an automatic promotion or a playoff season. You can see from Graph 1 that on 91 points we ended 1 point above my Autos Certain line. This line was for a set of results, that I produced at the start of the season, which would achieve 90 points and almost certain automatics. Apart from our October blip, it is amazing how close our season ran against this benchmark
Graph 1:

Graph 2 is the multiple comparison graph with our best recent Championship seasons. Graph 2 shows that at the end of the season, on 91 points we were 2 points ahead of our 89 points in Wilder’s promotion season in 18/19 and 1 point better off than Warnock’s 90 points in 05/06
Graph 2:

I guess that you’ll probably remember that I got quite excited when I realised that we could get 94 points, which would be our best equivalent points score ever at this level, beating the previous best in1953. In the end, as the table below shows, our 91 points was our best season at this level, since 1961. So Hecky had our best season at this level for over 60 years, and only sits behind Reg Freeman and John Harris in our all-time second tier legacy list.
Hecky’s Legacy Table:

Next, I’ve put below a coloured version of our full season results over time. The October blip is very evident – 3 points from 6 games – and in the last game in that period we were 2 down to Norwich after about a quarter of an hour. We came back to 2-2 and then Adam Davies saved a Pukki penalty in extra time, so we squeezed a point. That was a real turning point.
After that, if we hadn’t lost at home to Rotherham, we would have gone 15 games without losing – the real backbone to our season. Even In that Rotherham game we dominated everything, just couldn’t score and only lost to a Ben Wiles goal – but as he is Eddie Colquohoun’s grandson and it helped keep the Millers up we’ll take that one for Eddie.
For the rest of the season we had no draws and we only lost to Top 10 sides, apart from Udders!
Chronological Results Table:

And finally the completed League Table. There are some interesting generalities very evident from the colour patterns on this table. We do best against teams who take us on and try to play against us. The sides in the Top 6 probably benefitted from that, and took significant points off us. We broke down most teams in the middle 12 and took good points off them. However, quite a few teams in the bottom third really frustrated us by sitting back and breaking. We got less from those games than we should have done, especially Rotherham and QPR.
Personally, I have taken that as a result of the lack of pace in Norwood, Fleck and Egan against attacks down the centre. I remember as well, last time in the Prem, a few games with balls over the top which caught us out and got Egan a couple of red cards. Doyle and McA address that issue quite well if they stay, but it was very evident also how much it helped against Preston having Anel’s pace in the centre at the back. Only my opinions, others may disagree.
League Table:

Overall, my 5th promotion to the top flight in 52 years – so a fantastic once in a decade season for me. I’m looking forward to setting up next season’s graphs – probably run a comparison with Wilder’s 2 Prem seasons – as they cover both the highs and lows! – and a benchmark set of results to get 40 points.
All comments on any of my thoughts above and suggestions for next year are very welcome.
As they say on trendy American YouTube channels – “This is Ucandomagic,; Peace, Out!”
UTB & Slava Ukraini

